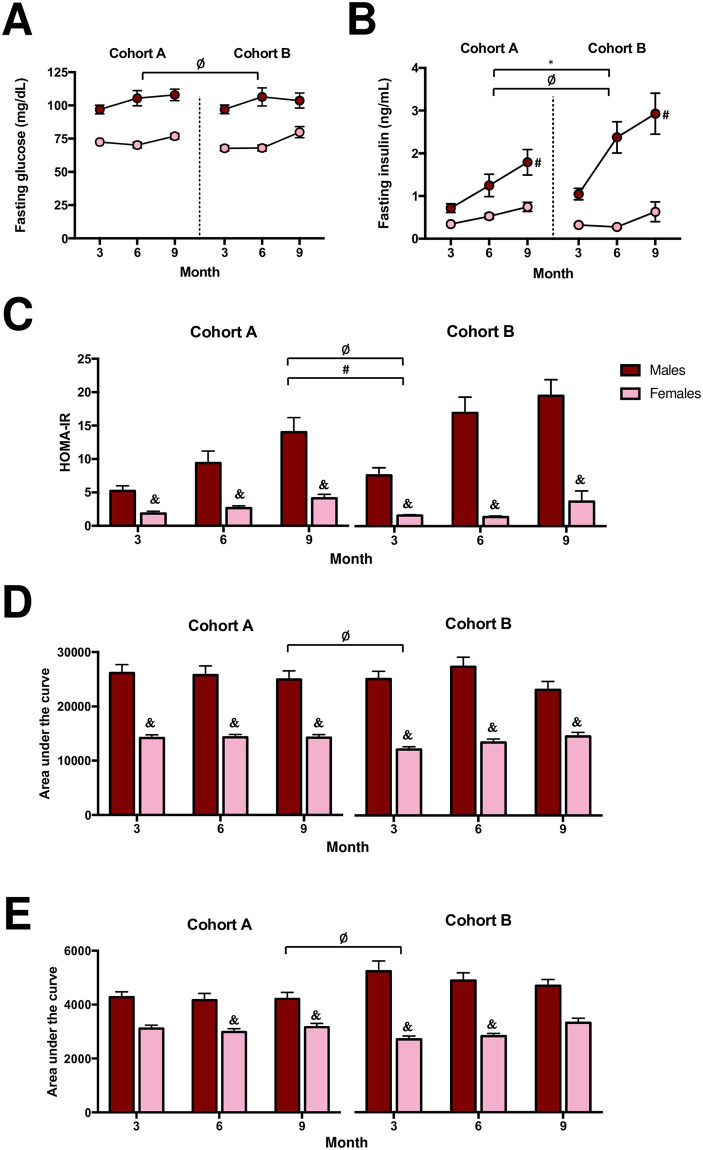
Fig 2. (A) Fasting glucose, (B) fasting insulin, (C) homeostatic model assessment of insulin resistance (HOMA-IR), (D) area under the curve of glucose tolerance test, and (E) area under the curve of insulin tolerance test of CD-1 mice received from two different animal husbandry facilities (Cohort A and B, respectively).
Mice of each cohort were allocated to one of four diet groups at four weeks of age (n = 10-11/cohort/sex/diet). Values are expressed as mean ± standard error of the mean. * = P < 0.05, Cohort A vs. Cohort B collapsed by time, sex, and diet. Ø = P < 0.05, males vs. females collapsed by cohort, time, and diet. # = P < 0.05, males of Cohort A vs. males of Cohort B collapsed by time and diet. & = P < 0.05, males vs. females within each respective month and cohort collapsed by diet.

