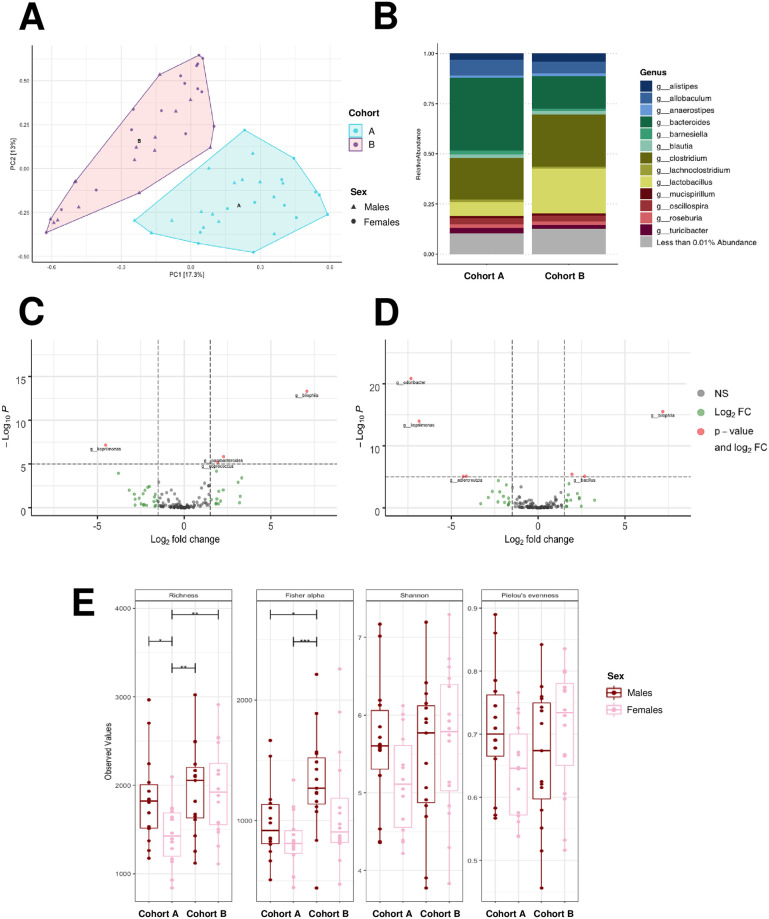
Fig 3. Colonic bacterial composition of male and female CD-1 mice received from two different animal husbandry facilities (Cohort A and B, respectively).
(A) Principal component analysis of bacterial composition, (B) relative abundance of bacterial genera, (C) enhanced volcano plot of bacterial genera that were differentially abundant in males of Cohort A (negative x-axis) and males of Cohort B (positive x-axis), (D) enhanced volcano plot of bacterial genera that were differentially abundant in females of Cohort A (negative x-axis) and females of Cohort B (positive x-axis), and (E) alpha diversity indices (richness, Fisher’s alpha, Shannon’s index, Pielou’s evenness) of bacteria in CD-1 mice. For colonic bacterial analysis, fecal samples were collected at ten months of age from a subset of mice from each diet group (n = 2-5/diet/sex, n = 28-31/cohort). NS = not significant and < log2(fold change), Log2 FC = > log2(fold change), P-value and log2 FC = > log2(fold change) and P < 0.05, * = P < 0.05, ** = P < 0.01, *** = P < 0.001.

