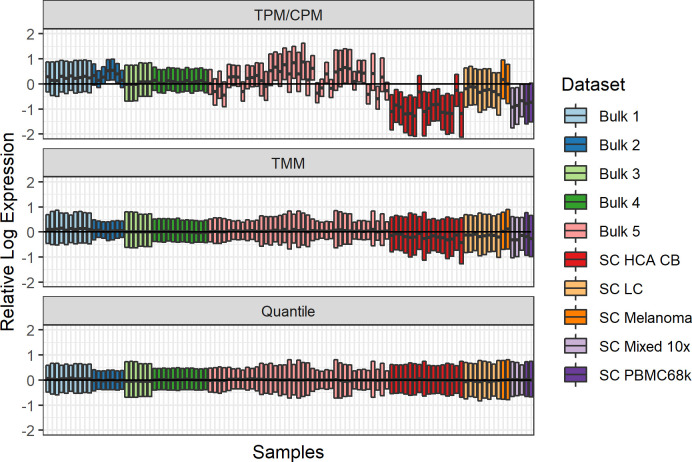
Fig 1. Evaluation of normalization methods for combined single-cell and bulk data.
Each bar is a boxplot over all genes describing the log2 fold change in gene expression between the expression in the sample and the mean expression over all samples. All genes ≥ 1 TPM on average across all samples, in total 12,072 genes, were included for each sample.

