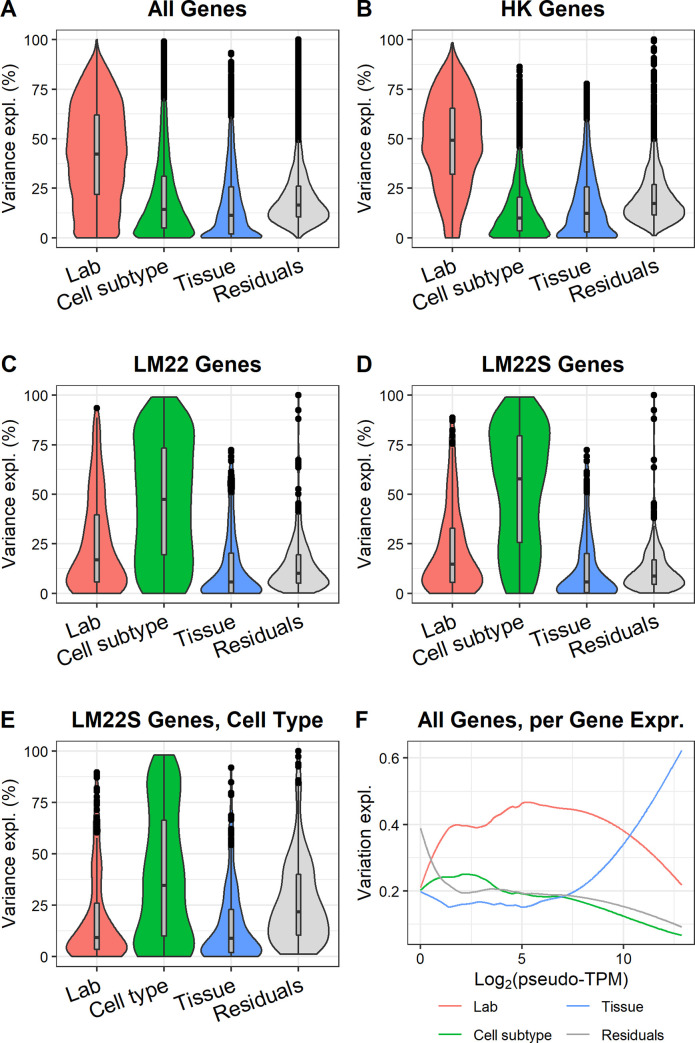
Fig 3. Explained variance in gene expression for bulk RNA-seq samples.
A. All genes (12072 genes). B. Housekeeping genes (3393 genes). C. LM22 (395 genes). D. LM22S genes. E. Identical to D, with the difference that cell subtype is replaced with cell type (B/T). F. Explained variance per gene expression. The plot shows how the explained variance by the different factors change with gene expression (Loess fit, span = 0.3).

