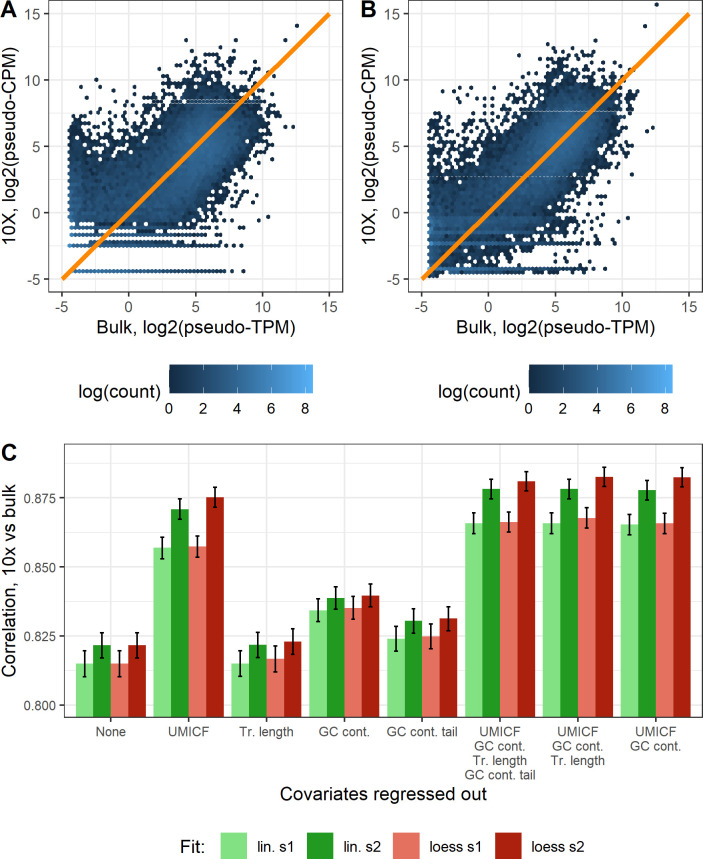
Fig 6. Improvement in correlation between 10x Chromium and bulk from regressing out covariates.
A. Gene expression for cortex 1 from the EVAL dataset plotted as 10x vs bulk. The orange line represents a perfect correlation. B. Gene expression for cortex 1 from the EVAL dataset after regressing out the differences in UMICF and GC content between 10x and bulk using a loess fit, which improves the correlation. C. Average Pearson correlation coefficient between 10x data and bulk in log scale after regressing out technical covariates (UMI copy fraction, transcript length, GC content and GC content tail), using linear or loess regression. The correlation shown is the average of the correlations from cortex 1 and 2 of the EVAL dataset. The error bars represent the confidence interval, based on bootstrapping of genes to include in the correlation.

