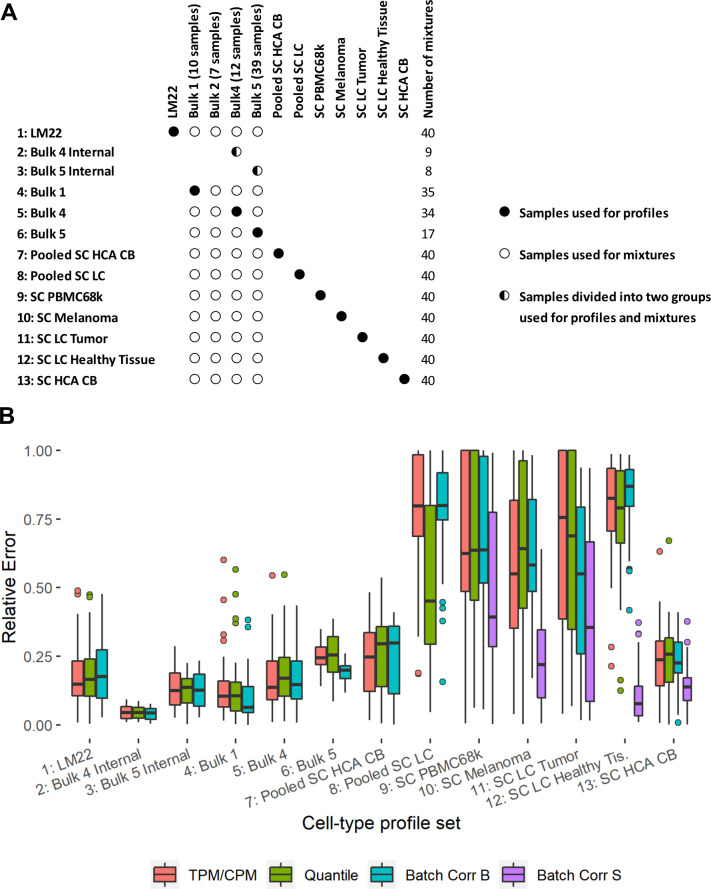
Fig 7. Deconvolution performance for different cell type profiles tested against in-silico generated bulk mixtures with 50% T cells and 50% B cells.
A. Overview of the profiles and mixtures used for deconvolution. The rows represent deconvolution runs and the columns data sources. B. Deconvolution performance. The figure shows the relative error of the B cell fraction estimated by CIBERSORTx. The Bulk 4/5 Internal profiles were generated from the Bulk 4/5 lab and were tested against mixtures generated from other samples from the same lab. The remaining profiles were tested against 40 mixtures generated from Bulk 1, 2, 4, and 5 (Bulk 3 has no T cell samples).

