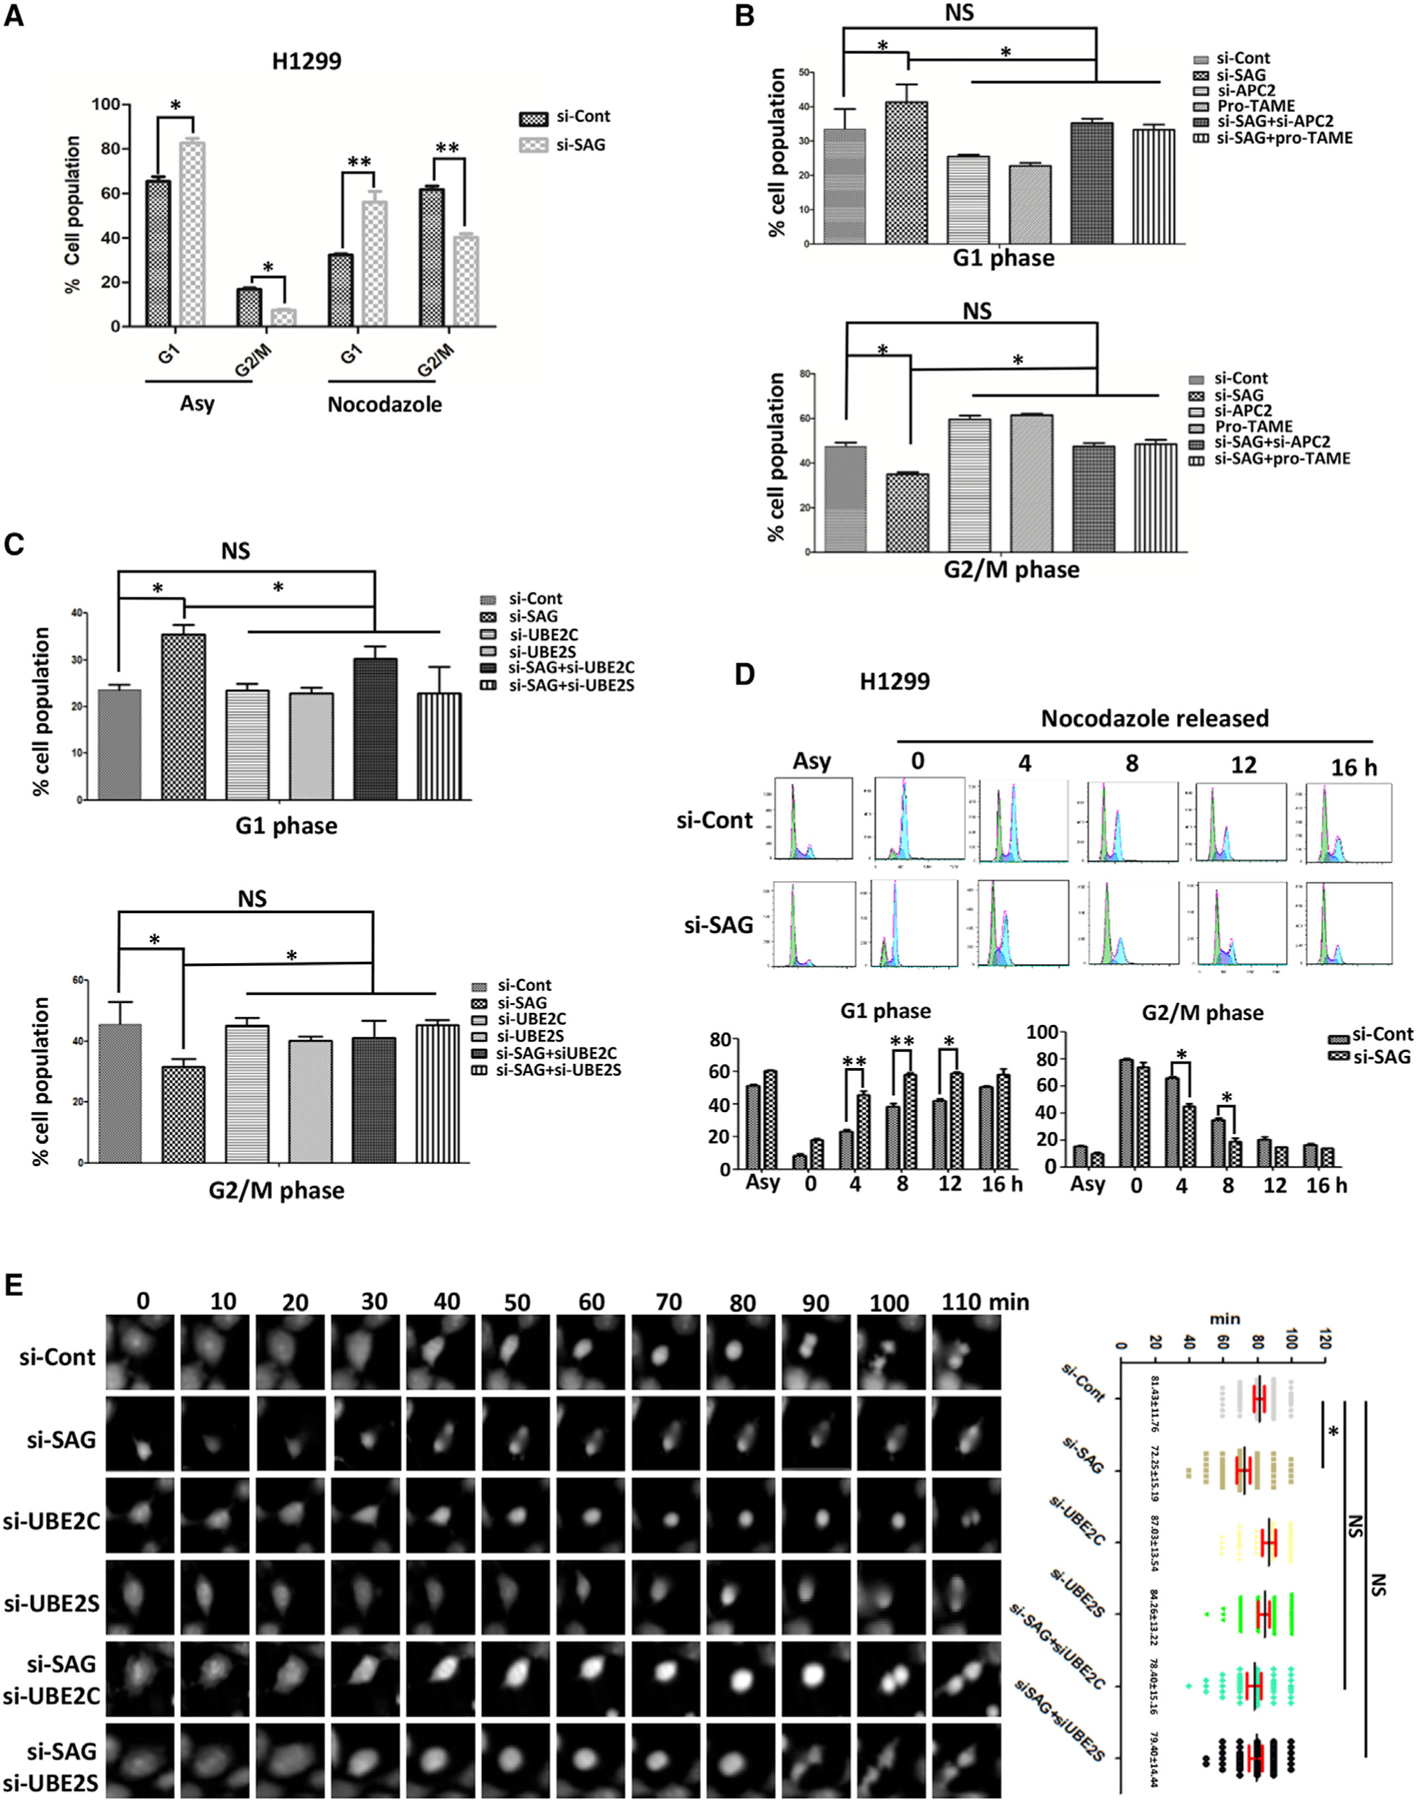
Figure 3. SAG Knockdown Promotes Mitotic Progression.

(A) H1299 cells were transfected with siRNA targeting SAG or control siCont for 48 h; cells were then treated with or without nocodazole for 24 h, followed by FACS analysis. The percentage of cell populations at the G1 and G2/M phase were plotted. Shown are mean ± SEM from three independent experiments. *p < 0.05, **p < 0.01.
(B) H1299 cells were transfected with siRNA targeting SAG or APC2 or control siCont for 24 h. Cells were then treated with nocodazole for 48 h in the presence or absence of pro-TAME, followed by FACS analysis. The percentage of cell populations at the G1 or G2/M phase was plotted. Shown are mean ± SEM from three independent experiments. *p < 0.05; NS, not significant.
(C) H1299 cells were transfected with various siRNA targeting indicated mRNAs, along with control siCont for 24 h. Cells were then treated with nocodazole for 48 h, followed by FACS analysis. The percentage of cell populations at the G1 and G2/M phases were plotted. Shown are mean ± SEM from three independent experiments. *p < 0.05; NS, not significant.
(D) H1299 cells were transfected with siRNA targeting SAG or control siCont for 24 h; cells were then blocked at the M phase by nocodazole treatment, and then released from the M phase for indicated time points for FACS analysis. The percentage of cell populations at the G1 and G2/M phases were plotted. Shown are mean ± SEM from three independent experiments. *p < 0.05, **p < 0.01.
(E) H1299 cells were transfected with various siRNA targeting indicated mRNAs, along with control siCont for 24 h, followed by G2 arrest by RO3306 for 24 h. Cells were then released from G2/M phase at the indicated time points when the photos of individual cells were taken (left). The time required for the separation into two daughter cells (mitotic time) was recorded and plotted (right). The results were derived from three independent experiments. *p < 0.01; NS, not significant.
Also see Figure S4.
