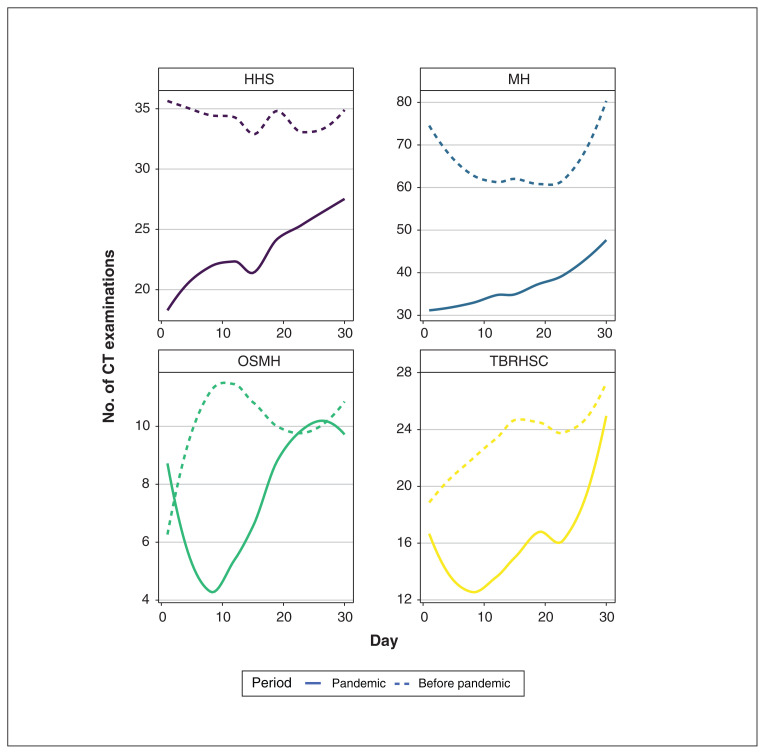
Figure 1:
Emergency department CT volumes in April 2019 (before the coronavirus disease 2019 pandemic) and in April 2020 (during the pandemic). Smooth curve fitting was performed using local polynomial regression (locally estimated scatterplot smoothing; LOESS). The less smooth curves for the smaller hospitals (OSMH and TBRHSC) may be attributable to random error from smaller sample sizes. CT = computed tomography, HHS = Hamilton Health Sciences, MH = Mackenzie Health, OSMH = Orillia Soldiers’ Memorial Hospital, TBRHSC = Thunder Bay Regional Health Sciences Centre.

