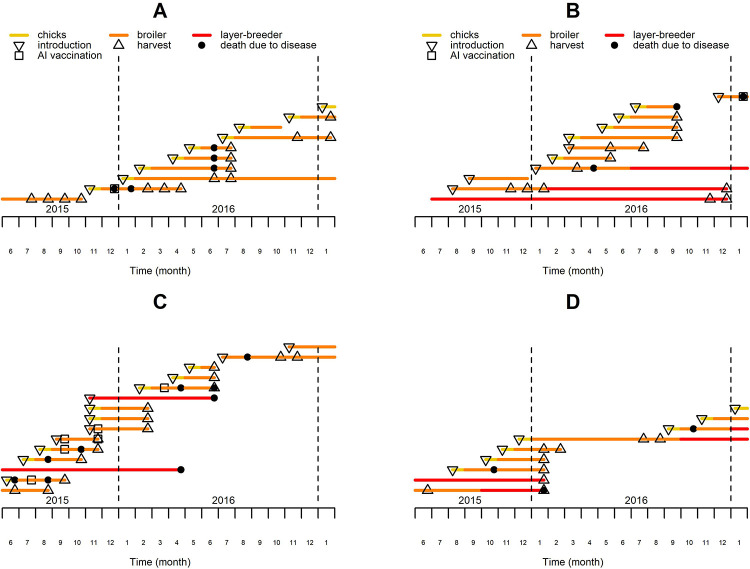
Figure 1. History of chicken flocks present in four of the observed farms over the study period.
Each colored line represents the period over which a single chicken flock was present on the farm, with the color code indicating the production type, which may vary during the course of the flock production period. The major events affecting the flocks are located with specific symbols on the corresponding lines and months.

