Figure 1. Observation of cis-interactions via single-molecule FRET.
(A) Representative heat map of donor and acceptor intensities showing two populations at high and low FRET efficiency indicated by the asterisks. The black line represents the threshold between the two states used to assign each observation to the high or low-FRET state. (B, E, H) Donor and acceptor trajectories for a FRET pair throughout representative trajectories, which are used to determine if the donor E-cad molecule is in a high-FRET or low-FRET state. (C, F, I) X and Y Cartesian coordinates for the donor or acceptor molecule over the length of the trajectory. (D, G, J) Two dimensional trajectory plots of the same trajectories, where the symbol color corresponds to the assigned FRET-state. The background of the trajectory time traces for intensity and position indicate the assigned FRET-state.
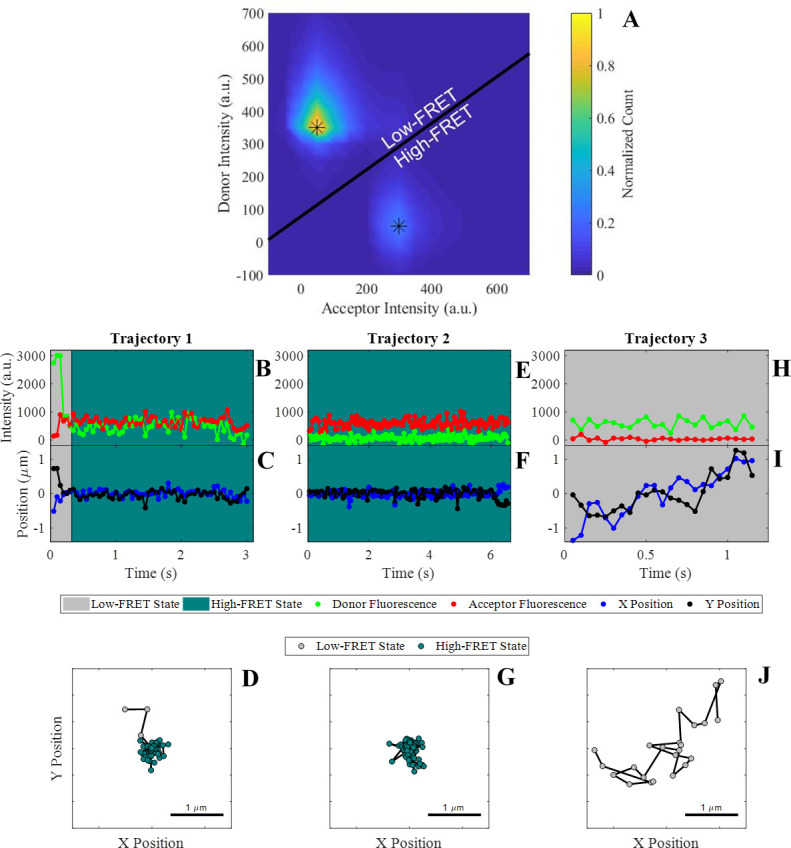
Figure 1—figure supplement 1. Heat maps showing binned acceptor and donor intensities using all molecular observations.
Figure 1—figure supplement 2. Overall complementary cumulative distributions of squared displacement calculated using only trajectories from a single movie for all three experimental conditions.
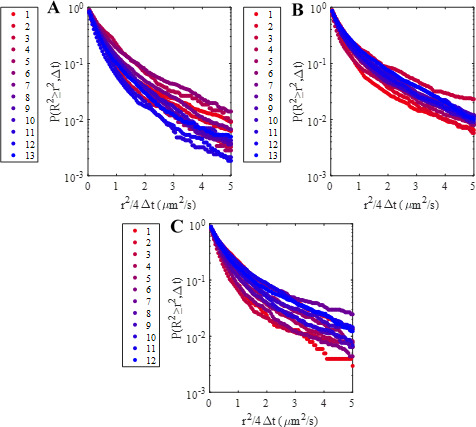
Figure 1—figure supplement 3. Complementary cumulative association time (high-FRET state dwell time) distributions calculated using only trajectories from a single movie for each of the three experimental conditions.
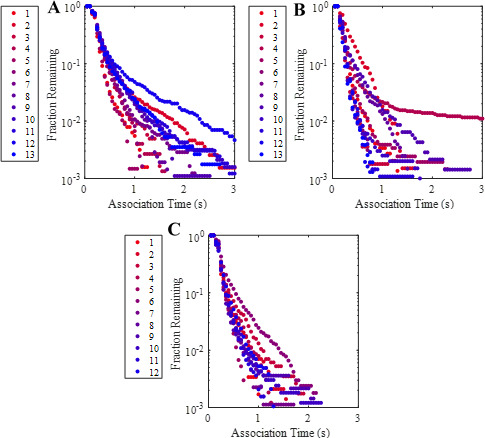
Figure 1—figure supplement 4. Fluorescence recovery after photobleaching (FRAP) analysis indicates the formation of a continuous, fluid supported lipid bilayer.
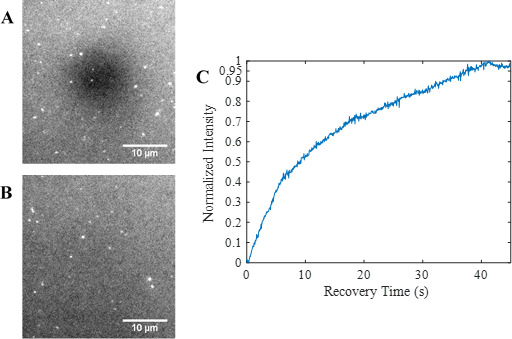
Figure 1—figure supplement 5. All localized and tracked trajectories two frames and longer from the 30 s high surface coverage wild-type movie clip included as Video 1 (left).
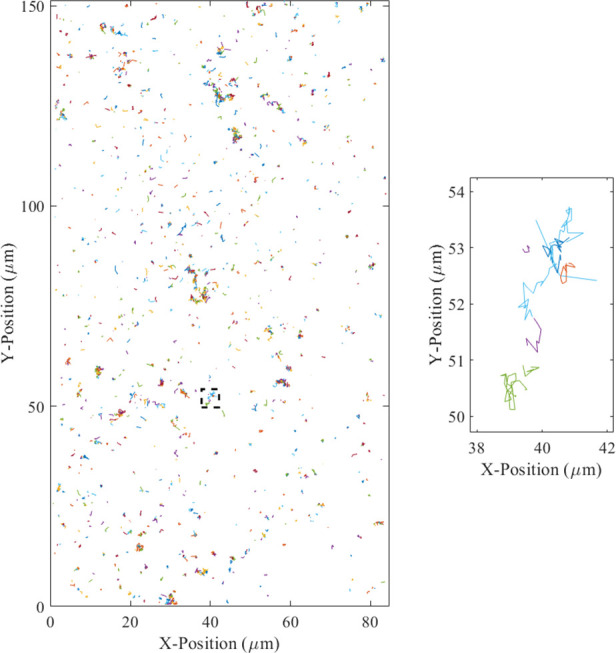
Figure 1—figure supplement 6. Representative histogram of positional localization uncertainties for all molecular observations for the high surface coverage wild-type condition indicating a significant number of observations with a large position uncertainty comparable to the size of a pixel (0.43 µm).
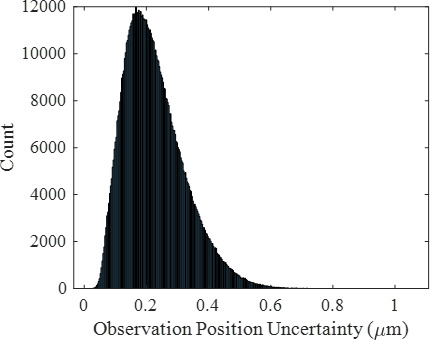
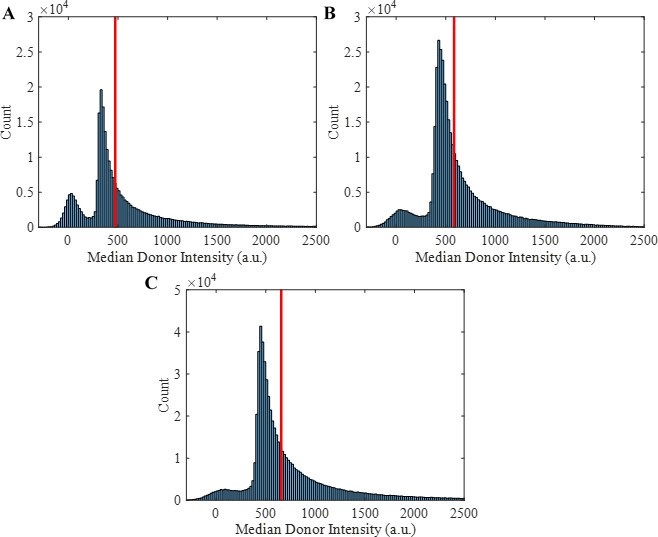
Figure 1—figure supplement 7. Trajectory median donor intensity histograms showing the 60th percentile cutoff as a vertical red line used to remove bright contaminants, donor E-cad aggregates, and donor E-cad labeled with multiple fluorophores.
