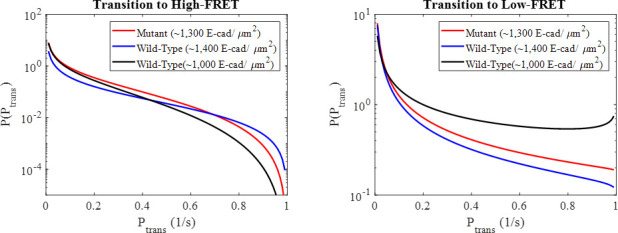
Figure 3. Average dissociation rate constants () for the mutant and two wild-type conditions resulting from modeling interactions using a Markov model.
Error bars were estimated as the square root of the Cramèr-Rao lower bound.
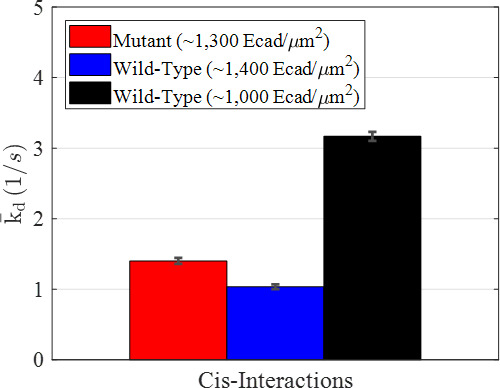
Figure 3—figure supplement 1. Complementary cumulative association time (high-FRET state dwell time) distributions calculated for each of the three high surface coverage experimental conditions and the low coverage control.
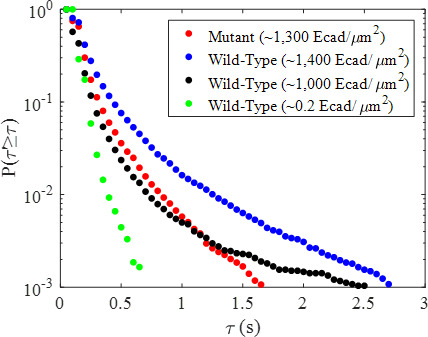
Figure 3—figure supplement 2. High-FRET and low-FRET complementary cumulative surface residence time (observation time) distributions for mutant E-cad and two concentrations of wild-type E-cad.
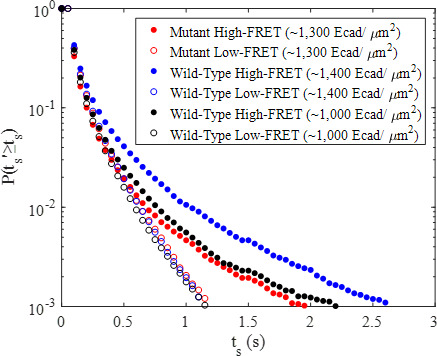
Figure 3—figure supplement 3. Complementary cumulative state dwell time distributions for the high and low-FRET states for the mutant and two wild-type E-cad conditions, compared to the predicted state dwell time distributions based upon the three-state, heterogeneous Markov model maximum likelihood estimate with beta-distributed transition probabilities.
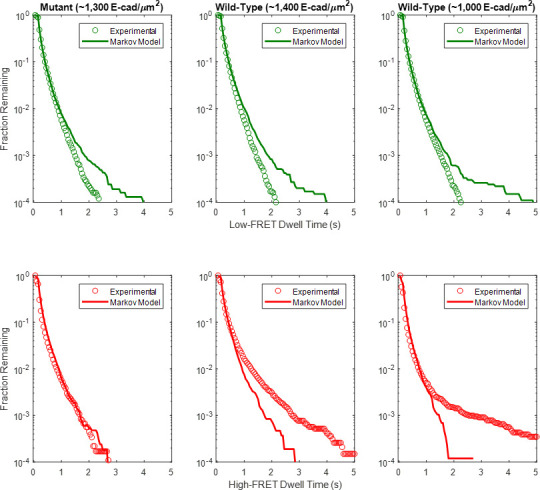
Figure 3—figure supplement 4. Probability density functions for the state transition rates between the high and low-FRET states for the mutant and wild-type conditions determined based upon the Markov model estimated, beta-distributed transition probabilities.
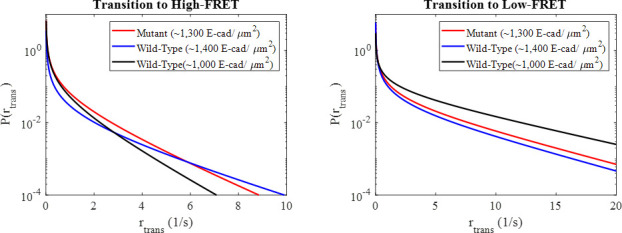
Figure 3—figure supplement 5. Low-FRET state complementary cumulative dwell time distributions for the mutant and two wild-type conditions.
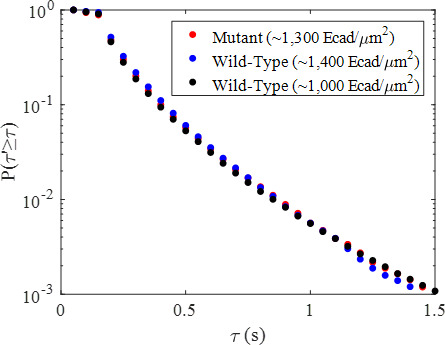
Figure 3—figure supplement 6. Beta distributions of state transition probabilities between the high and low-FRET states for the mutant and two wild-type conditions corresponding to the Markov model maximum likelihood estimated beta distribution parameters.
