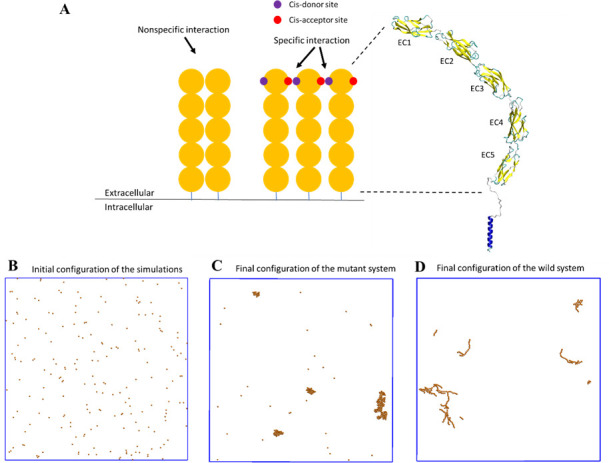
Figure 4. A coarse-grained model was constructed to simulate the spatial-temporal process of E-cad clustering.

(A) E-cad extracellular domains (orange), nonspecific and specific cis-interactions. Cis-donor sites are labeled in purple, and cis-acceptor sites are labeled in red. A structural model of the E-cad is shown on the right side. Ectodomain structure with EC domains 1–5 numbered from the N-terminus. (B) Top view of initial configuration in the simulations. The number of E-cad molecules is equal to 200. (C) Top view of final configuration in the mutant system. (D) Top view of final configuration in the wild-type system.
