. 2020 Sep 2;9:e59035. doi: 10.7554/eLife.59035

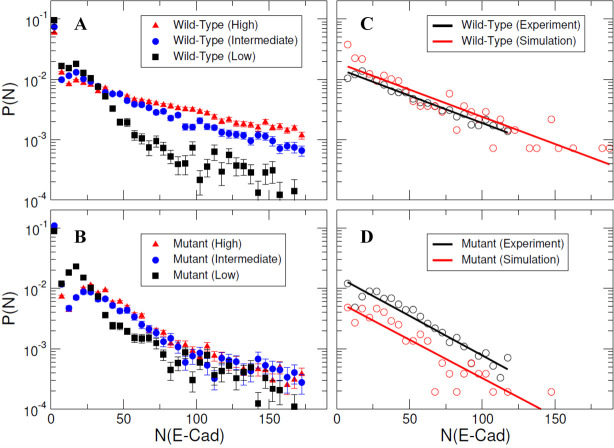
Figure 5. Specific and nonspecific interactions can cause E-cad clustering.

(A–B) Representative experimental cluster size probability distribution functions for wild-type and mutant E-cad at low, intermediate, and high surface coverages. Error bars correspond to the standard deviation of cluster size probability distribution functions calculated using 100 samples using a bootstrap method with replacement. (C–D) The comparison of experimental and simulated cluster size distributions for mutant and wild-type E-cad. The solid lines indicate the single exponential fitting.

Figure 5.

Figure 5—figure supplement 1. Distributions of mutant E-cad cluster size for different combinations of nonspecific interaction on/off rate.
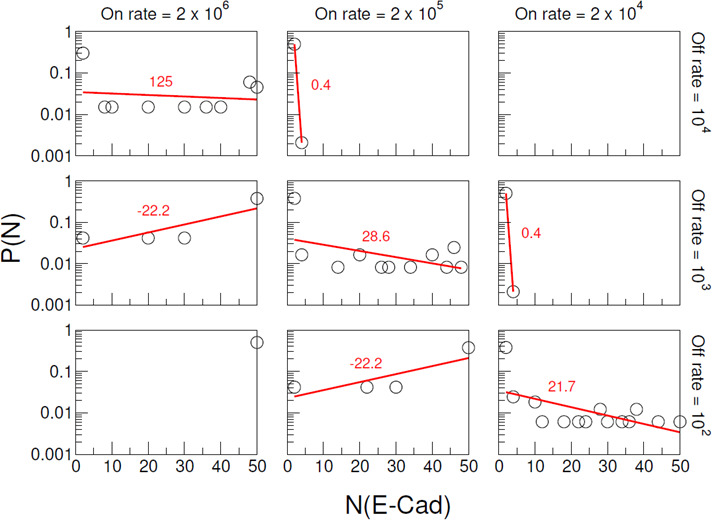
Figure 5—figure supplement 1.

The 1st, 2nd and 3rd columns correspond to on rate 2 × 106 s−1, 2 × 105 s−1, and 2 × 104 s−1, respectively. The 1st, 2nd and 3rd rows correspond to off rate 104 s−1, 103 s−1, and 102 s−1, respectively. In each panel, the cluster size distributions are fitted by a single exponential function f(N)=AeN/N0 with a constant N0 corresponding to the characteristic cluster size. The fitted line and N0 values are colored in red.
Figure 5—figure supplement 2. Distributions of wild-type E-cad cluster size for different combinations of specific interaction on/off rate.
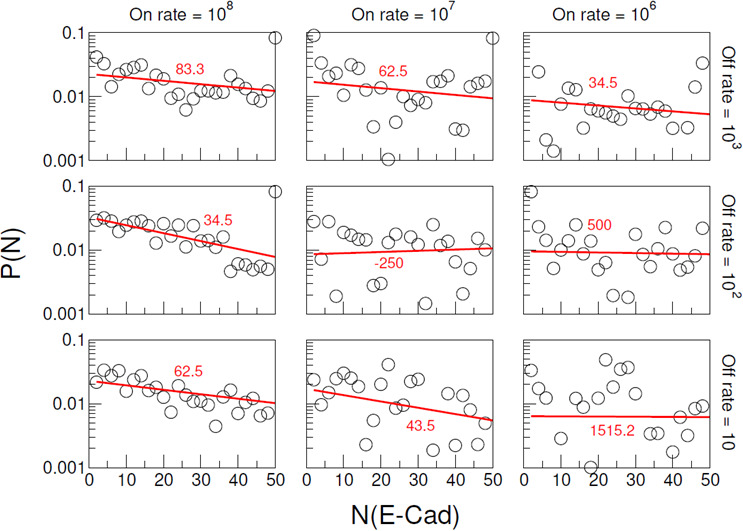
Figure 5—figure supplement 2.

The columns correspond to on rate 108 s−1, 107 s−1, and 106 s−1, respectively. The rows correspond to off rate 103 s−1, 102 s−1, and 10 s−1, respectively. Nonspecific interaction on and off rates, respectively, were fixed at 2 × 105 s−1 and 103 s−1. In each panel, the cluster size distributions are fitted by a single exponential function f(N)=AeN/N0 with a constant N0 corresponding to the characteristic cluster size. The fitted line and N0 value are colored in red.
Figure 5—figure supplement 3. E-cad is primarily bound to a single lipid.
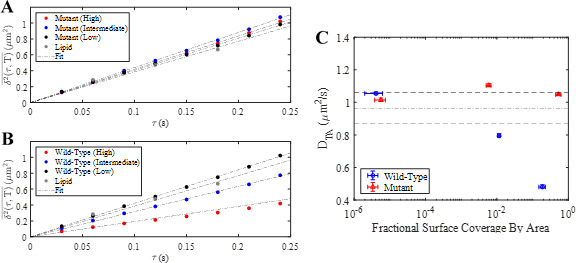
Figure 5—figure supplement 3.

(A) Ensemble-time-averaged MSDs for mutant E-cad at high, intermediate and low surface coverage and a lipid in the bilayer. Linear fits are shown as the dot-dashed line. (B) Ensemble-time-averaged MSDs for wild-type E-cad at high, intermediate and low surface coverage and a lipid within the bilayer. Linear fits are shown as the dot-dashed line. (C) Resulting time-averaged diffusion coefficients (DTA) for wild-type and mutant E-cad as a function of fractional surface coverage by area. Error bars represent the 95% confidence interval calculated from fitting error. Fractional surface coverage by area calculations are described elsewhere by Thompson et al., 2019 (Thompson et al., 2019). The dot-dashed line represents the value of DTA for a lipid in an E-cad free bilayer and the dashed lines indicate the 95% confidence interval calculated from fitting error for the lipid MSD.
Figure 5—figure supplement 4. Trajectory averaged friction factor probability distributions for wild-type (top) and mutant (bottom) E-cad at high, intermediate, and low E-cad surface coverage.
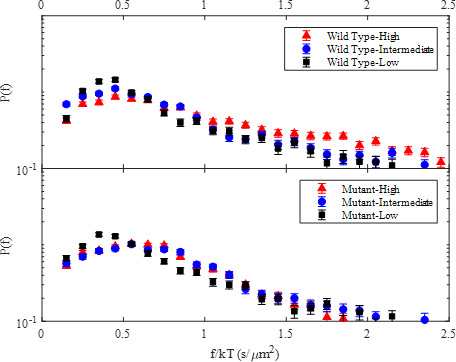
Figure 5—figure supplement 4.

The peak at a friction factor of ~0.5 s/µm2 corresponds to monomeric E-cad and was used to normalize all cluster size calculations.
Figure 5—figure supplement 5. Distribution of cluster size for wild-type and mutant E-cad at a surface density of 312.5 E-cad/µm2, 625 E-cad/µm2, and 1,250 E-cad/µm2, respectively.
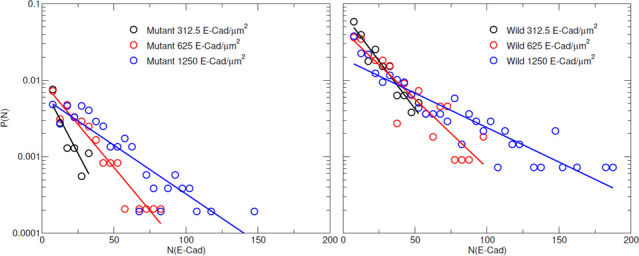
Figure 5—figure supplement 5.

The data are fit to a single exponential.