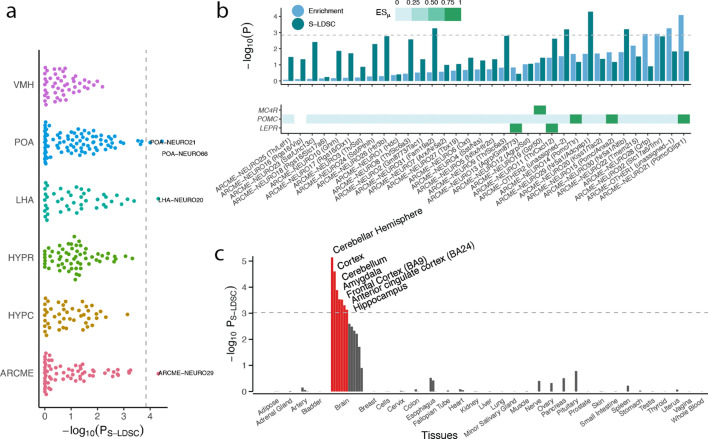
Figure 5. BMI GWAS enrichment across hypothalamic cells and human tissues.
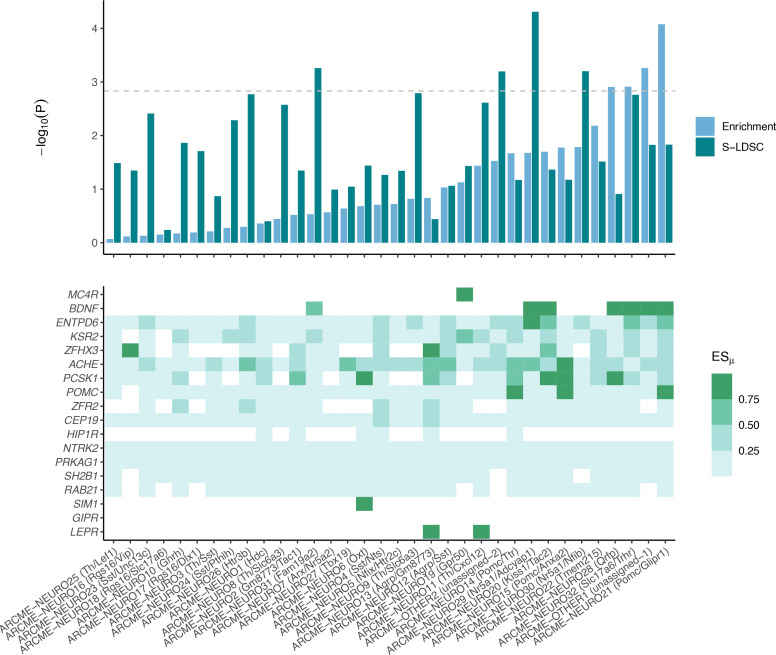
(a) BMI GWAS enrichments across 347 hypothalamic cell types derived from studies of the Arc-ME (ARCME), the ventromedial hypothalamus (VMH), the lateral hypothalamus (LHA), the preoptic nucleus of the hypothalamus (POA) and the entire hypothalamus (HYPR and HYPC). For each study, CELLEX and CELLECT were run individually, and subsequently all cell types were pooled and significance was determine based on Bonferroni correction (p<0.05/347). Four cell types were significantly enriched, namely POA-NEURO66 (Reln+; Moffitt et al., 2018) and POA-NEURO21 (Cck+/Ebf3+; Moffitt et al., 2018) from the preoptic area of the hypothalamus, ARCME-NEURO29 (Sf1+/Adcyap1+; Campbell et al., 2017) from the Arc-ME, and LHA-NEURO20 (Ebf3/Otb+; Mickelsen et al., 2019) from the lateral hypothalamus. (b) CELLECT and high-confidence obesity genes enrichments for neuronal cell populations in the Arc-ME (upper panel). Expression of Mc4r, Pomc and Lepr across Arc-ME neuronal populations, white squares means that the given gene is not expressed in at least 10% of the cells in the given cell population, non-white squares denote increasingly specific gene expression (lower panel). (c) CELLECT enrichment analysis of Genotype-Tissue Expression Consortium (GTEx) RNA-seq data. Orange bars denote significantly enriched tissues. The hypothalamus datasets’ metadata, CELLECT results and expression specificity values for the enriched cell types are available in Figure 5—source datas 1–3. The GTEx tissue annotations, CELLECT and high-confidence obesity genes enrichment results are available in Figure 5—source datas 10–12. POA, preoptic area of the hypothalamus; LHA, lateral hypothalamus; ARCME, arcuate nucleus and median eminence complex; S-LDSC, stratified-linkage disequilibrium score regression.


