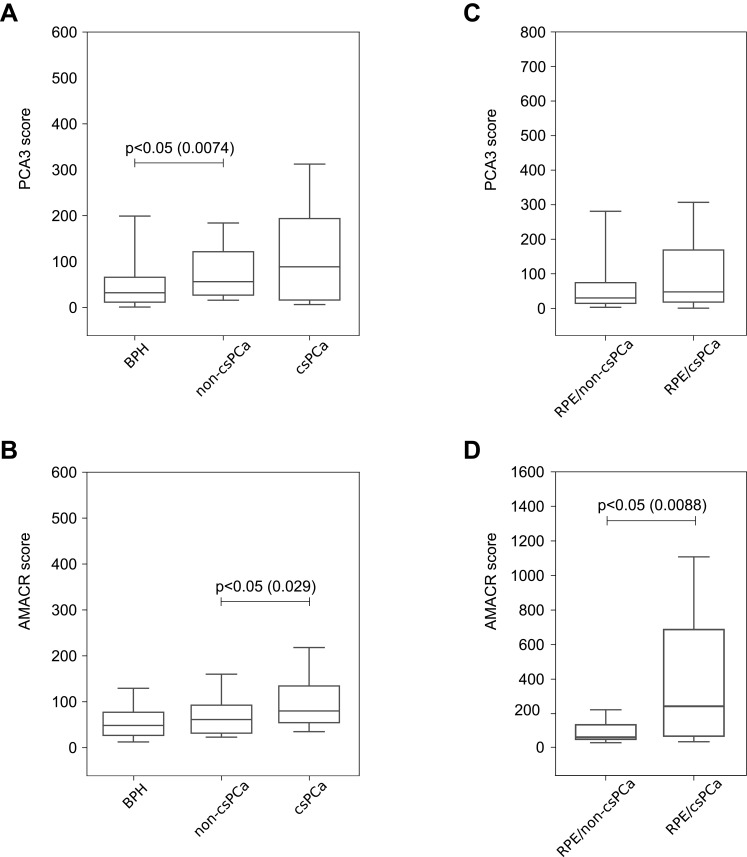
Figure 1.
PCA3 and AMACR scores in groups of patients with BPH, non-csPCa and csPCa. Box whiskers correspond to 5th and 95th percentile outliers are not shown. (A) PCA3 score, prebiopsy cohort, (B) AMACR score, prebiopsy cohort, (C) PCA3 score, patients scheduled for RPE, (D) AMACR score, patients scheduled for RPE.

