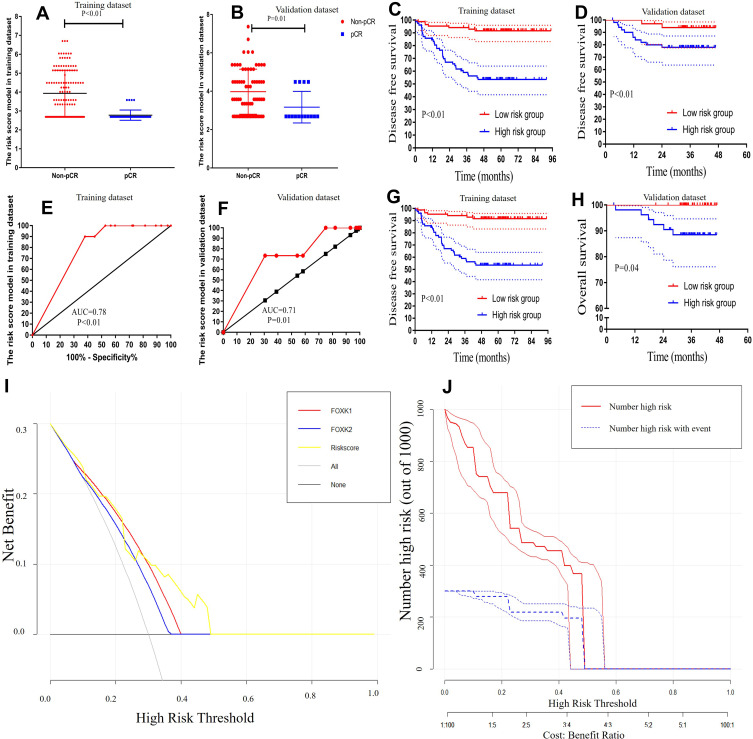
Figure 7.
Validation the risk score model. (A and B) the expression of risk score were lower in the pCR group compared with the non-pCR group in the training dataset and validation dataset (training dataset, 4.33±0.10 vs. 2.47±0.03, P<0.01; validation dataset, 4.37±0.13 vs. 2.85±0.20, P<0.01) (C and D) Kaplan-Meier analysis of risk score models for Disease-free survival. (E and F) ROC analysis demonstrated that risk score has a powerful ability to predict pCR in the training dataset and the training dataset (training dataset, AUC=0.98, P<0.01; validation dataset, AUC=0.88, P<0.01). (G and H) Kaplan-Meier analysis of risk score model for overall survival. (I) Decision curve analysis for pCR (J) Clinical impact curve for the risk model. Of 1000 patients, the red solid line shows the total number of patients deemed to be at high risk for each risk threshold. The blue dashed line shows how many of those would be true positives.

