
Figure 3. Diverse drug responses in LIMORE.
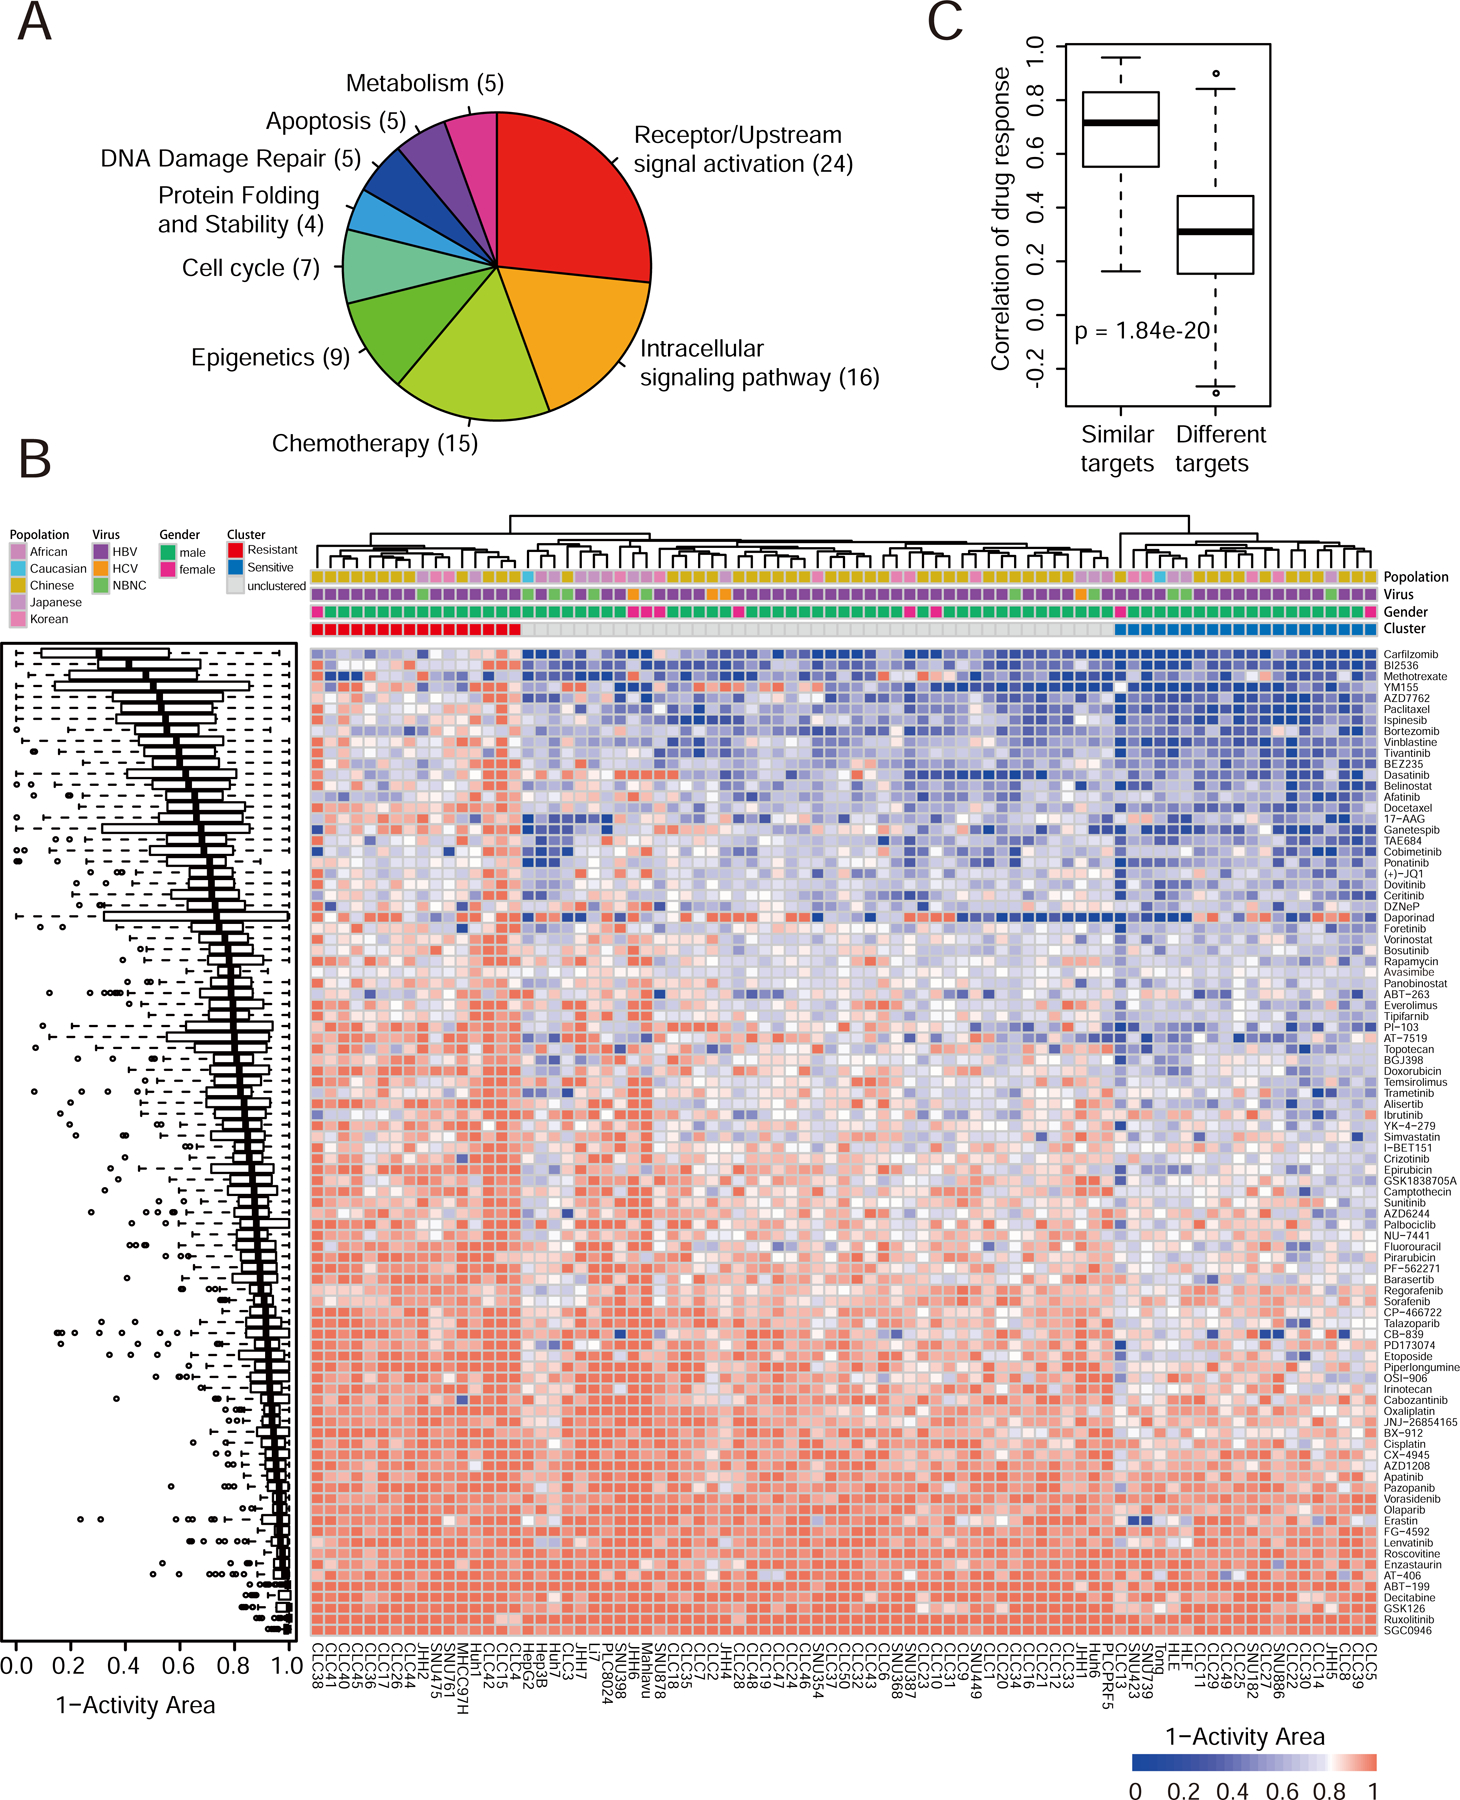
(A) Pieplot shows mechanism of action of 90 screened drugs.
(B) Boxplot shows drug response distributions (left) and heatmap shows drug responses in 81 LIMORE models (right). Red represents resistant cluster (Cluster R) and blue represents sensitive cluster (Cluster S). Drug response value is presented as the 1-Activity Area.
(C) Boxplot shows Spearman correlations of drug pairs with similar or different targets in LIMORE dataset.
For box-and-whisker plot, the box indicates IQR, the line in the box indicates the median, the whiskers indicate points within Q3+1.5×IQR and Q1−1.5×IQR and the points beyond whiskers indicate outliers. See also Figure S3 and Table S4.