
Figure 6. Prediction models and biomarkers for sorafenib.
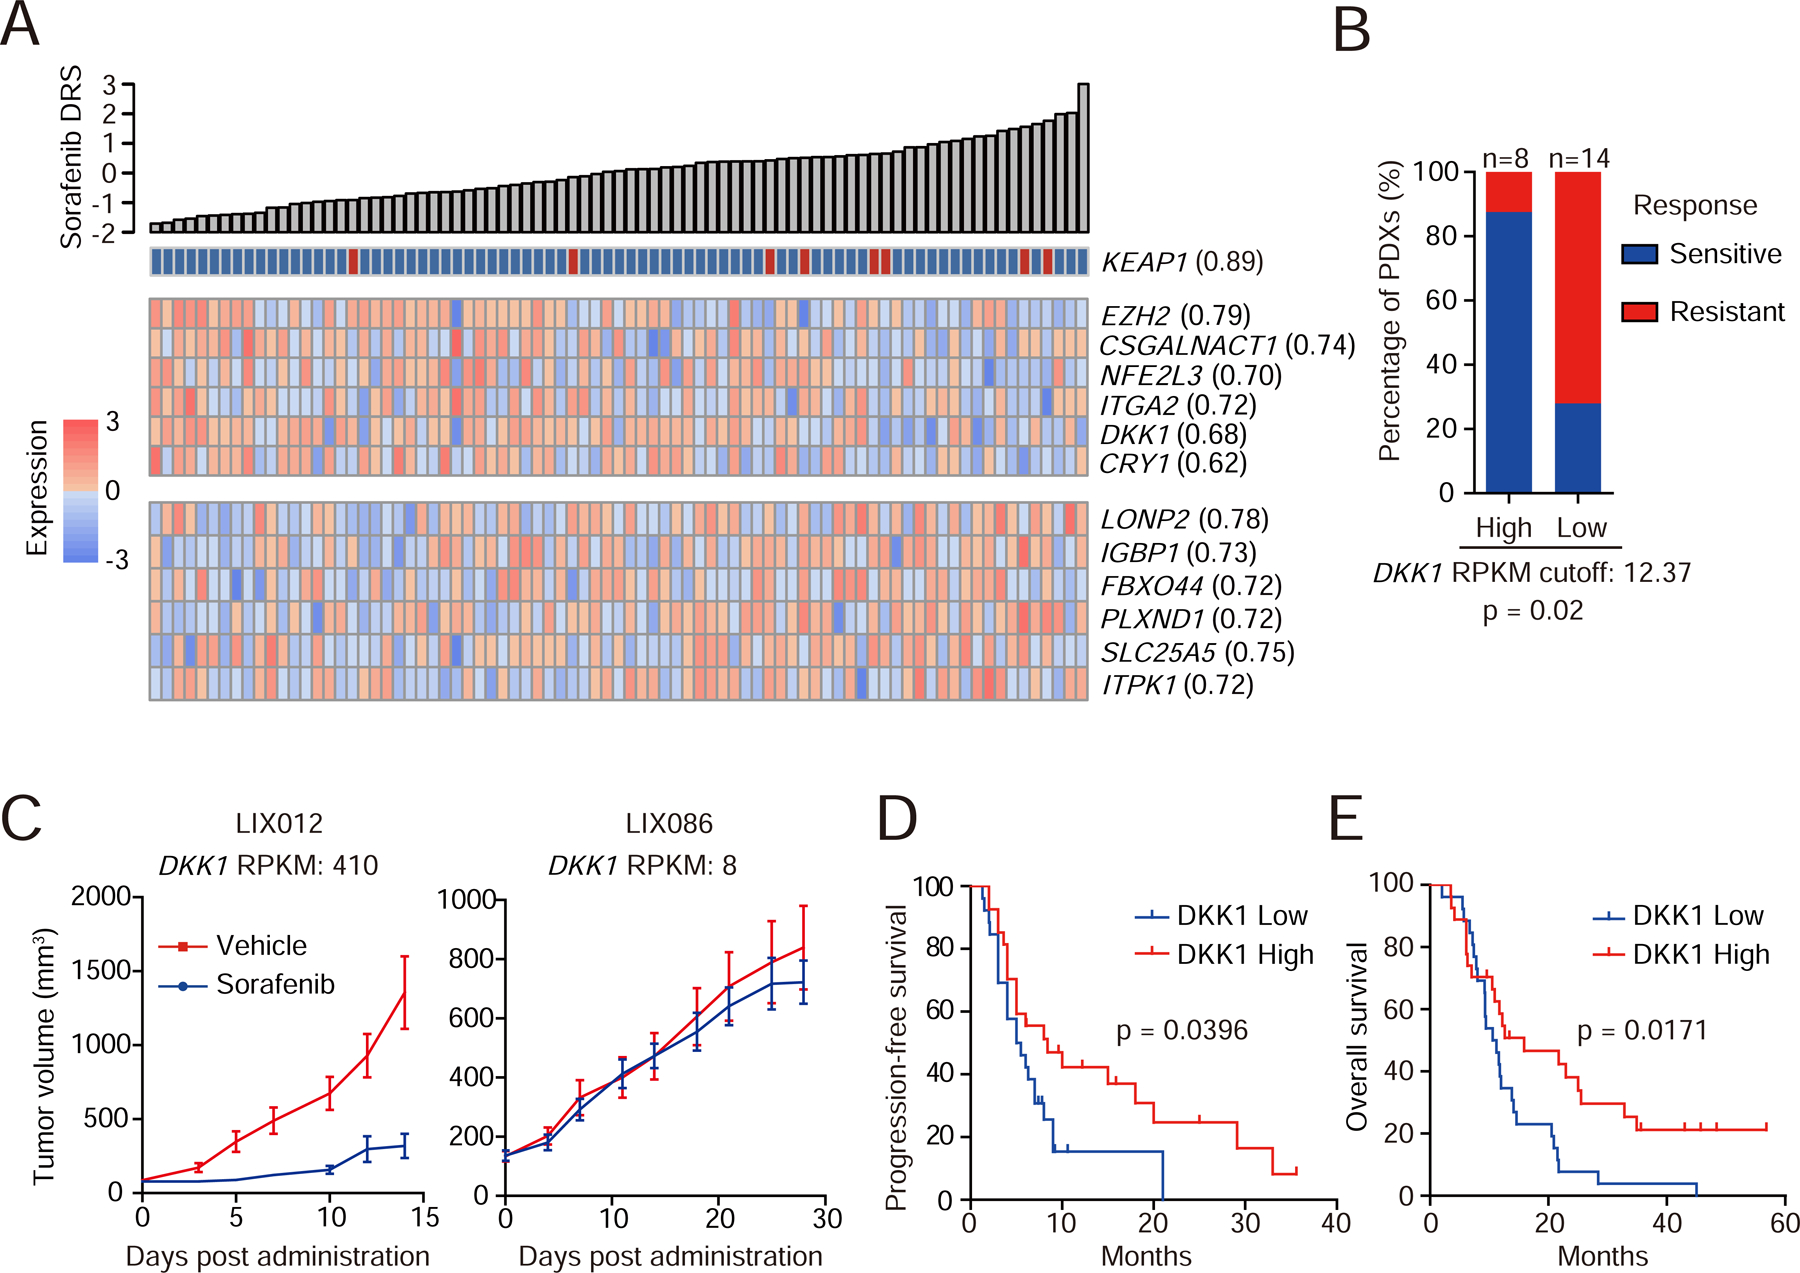
(A) Heatmap shows top predictive CFG and expression features associated with sorafenib response.
(B) The 22 PDXs were classified into DKK1-high or -low group using the optimal cutoff. PDXs with treatment-to-control ratio < 0.25 were considered sensitive to sorafenib, otherwise resistant. Gene expressions in RNA-Seq are presented as Reads Per Kilobase per Million mapped reads (RPKM). Statistics, Fisher’s exact test.
(C) Tumor growth curves of two representative PDXs (LIX012 and LIX086) with different DKK1 levels. Data are presented as mean±SEM. n=10 mice/group.
(D and E) Kaplan-Meier plots for progression-free (D) and overall (E) survival of HCC patients grouped by the median of serum DKK1 levels. Statistics, Log-rank test.