
Fig. 8.
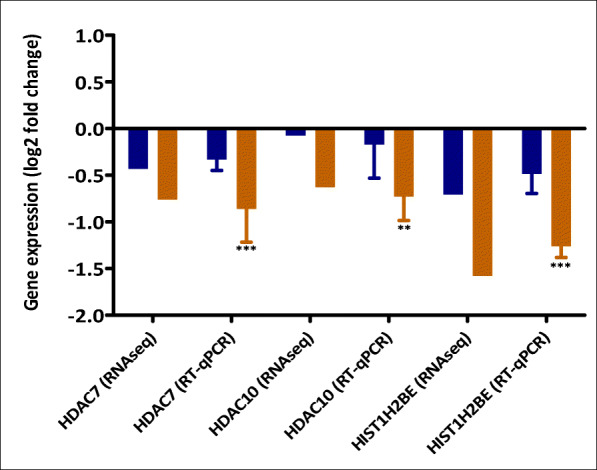
Example of genes that are significantly downregulated by DES (orange) only that are involved in histone deacetylation and related DNA methylation. The expression was considered significant if log2 FC > 0.6 and moderated p value < 0.05. For RT-qPCR results, bars represent average ± SEM from at least three independent experiments. For statistical analysis of the RT-qPCR data, multiple paired t tests were performed and differences were considered significant if p value < 0.05