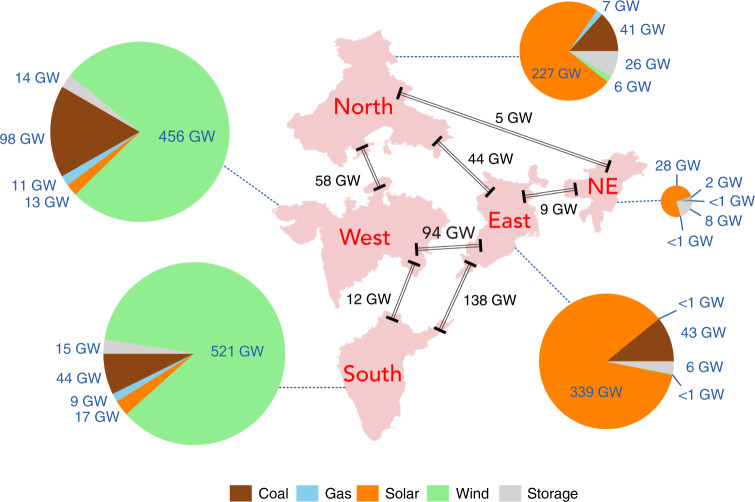
Fig. 2. Regional capacities.
Regional distribution of capacities inferred for 2040 using the cost-optimization model applied to the standard 80% renewables scenario. Links between regions indicate capacities identified for optimal interregional transmission. The size of the pie charts is proportional to the cumulative generation capacities for each region. This figure was constructed in MATLAB version 2017b and edited in Adobe InDesign 2020.

