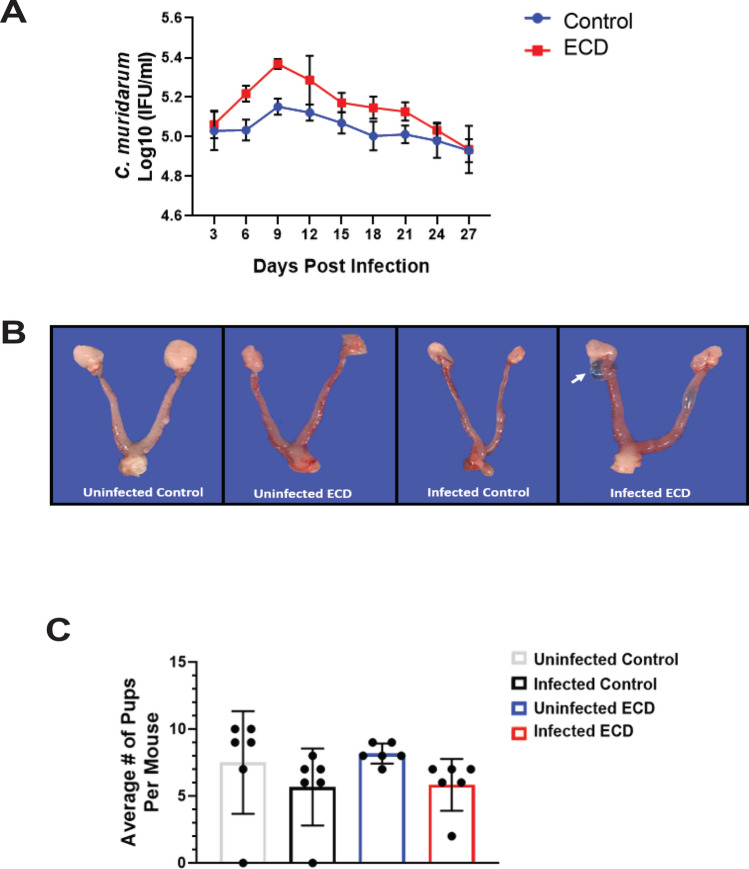
Figure 8.
Effect of ECD on chlamydial pathogenesis after Chlamydia infection in the early active period. (A) Chlamydia infectivity in ECD and control mice (n = 12 per group) infected at ZT15 was determined. Data was analyzed using a two-way repeat measure ANOVA and Tukey post hoc test. (B) ECD mice had periovarian cysts (next to the ovary, as indicated by the white arrow), while infected control mice did not have periovarian cysts (n = 6 per group). (C) Fertility of ECD and control mice infected with C. muridarum at ZT15 was determined by analyzing the number of pups per mouse (n = 6 per group). The data was analysed using a one-way ANOVA and Tukey post hoc test.

