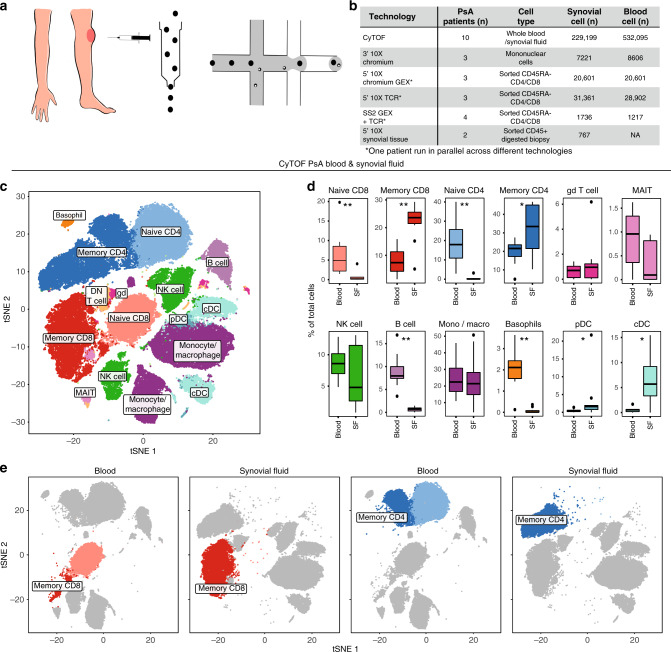
Fig. 1. Landscape of synovial leukocyte populations in psoriatic arthritis.
a Overview of experimental design. b Cell numbers used in each of the experimental techniques. c Representative map of CyTOF clusters derived from one PsA patient’s matched peripheral blood and synovial fluid cells using t-SNE. d Boxplots showing cluster frequencies within blood and synovial fluid (SF) from ten independent experiments. All replication attempts were successful. For all boxplots, the upper whisker extends to the largest value, maximally 1.5 × IQR from the 75th centile, and the lower whisker extends to the smallest value, 1.5× IQR from the 25th centile. The junctions of whisker and box (hinge) represent the 25th and 75th centiles, while median is indicated by the central line. Outlier values are plotted individually beyond the whiskers. Two-sided paired t test with Bonferroni correction. n = 10 (* = p < 0.05, **=p < 0.01, ***=p < 0.001). Exact p value naive CD8, memory CD8, naive CD4, B cells and basophils = 0.0059, memory CD4 = 0.025, pDC = 0.032 and cDC = 0.013. e Representative map of CyTOF clusters derived from one PsA patient, divided according to tissue of origin and highlighting memory CD8 (dark red) and memory CD4 (dark blue) T cells. Source data are provided as a Source Data file.

