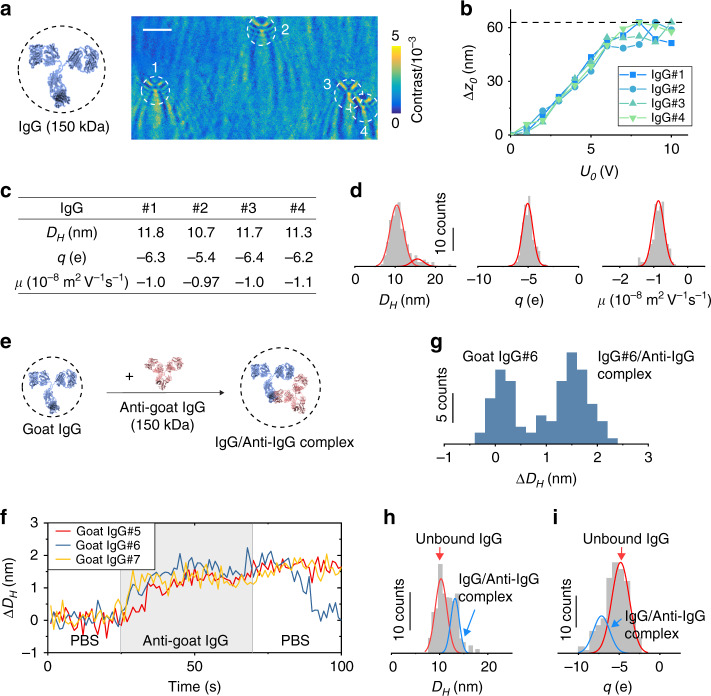
Fig. 2. Quantifying the size, charge, and mobility of single proteins.
a FFT image of immunoglobulin G (IgG) measured with potential amplitude, U0 = 8 V. Scale bar, 3 µm. b Oscillation amplitude (Δz0) vs. potential amplitude (U0) plots for the IgG molecules marked in a, from which diameter (DH), charge (q), and mobility (µ) are obtained. c Measured DH, q, and µ of the molecules shown in b. d Histograms of DH, q, and µ measured for 186 IgG molecules, where the red curves are Gaussian fittings (see Supplementary Table 4). e Anti-goat IgG is introduced to bind with goat IgG tethered on the surface. f Binding/unbinding of anti-goat IgG with three goat IgG molecules tracked in real time, showing diameter changes associated with the binding and unbinding events. Potential amplitude: U0 = 9 V. Buffer: 100× diluted PBS at pH = 7.4. Anti-goat IgG concentration:130 nM. g Size distribution of a goat IgG molecule (#6 shown in f) measured during its binding/unbinding with anti-goat IgG, where the two peaks correspond to IgG and anti-IgG/IgG complex, respectively. h, i DH and q histograms of 137 goat IgG molecules obtained after incubation with 33 nM anti-goat IgG for ~30 min, where the two peaks are due to IgG and anti-IgG/IgG complex (see Supplementary Table 4 for the extracted mean DH and q; Supplementary Fig. 4a for the mobility histogram). The blue and red lines are Gaussian fittings of the peaks.

