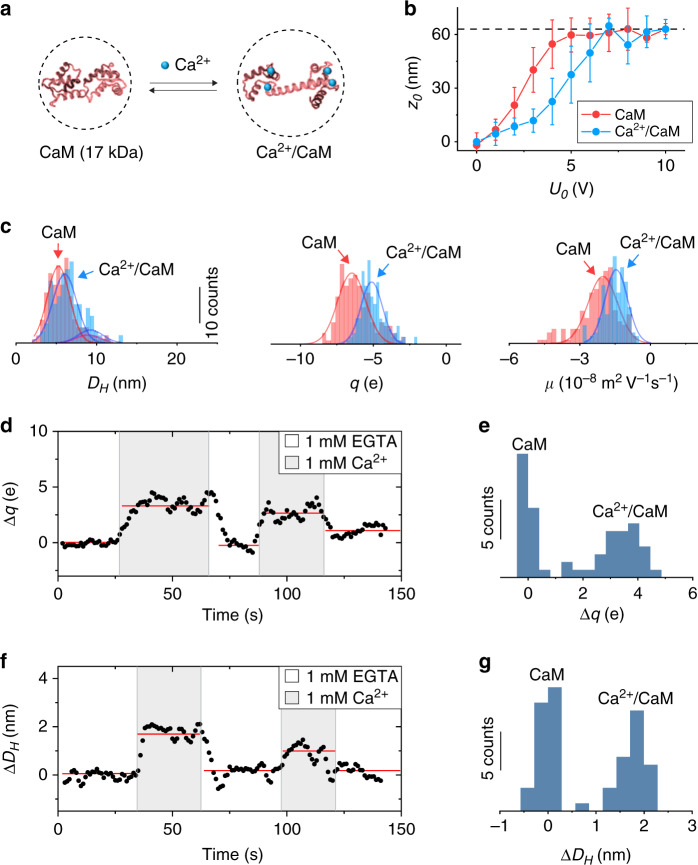
Fig. 3. Ligand binding-induced conformation change in a protein.
a Binding of Ca2+ to calmodulin (CaM) causes conformation and charge changes in CaM. b Oscillation amplitude vs. U0 plots before (red) and after (blue) Ca2+ binding to CaM, where the vertical bars are standard deviations of >150 CaM or Ca2+/CaM molecules. c Statistical analysis for 150 CaM molecules (red) and 151 Ca2+/CaM molecules (blue) showing the diameter (DH), charge (q) and mobility (µ) distributions of CaM and Ca2+/CaM complex (see Supplementary Table 4 for a summary). The red and blue lines are Gaussian fittings of the peaks. d, f Tracking of the charge (Δq) and size (ΔDH) changes of a single CaM molecule induced by Ca2+ binding over time, where the size change was measured with U0 fixed at 7 V (the plateau regime) and the charge measurement was performed with U0 = 4 V (the linear regime). The binding and unbinding of Ca2+ to CaM were performed by alternatively flowing 1 mM EGTA and 1 mM Ca2+ in 100× diluted PBS (at pH = 7.4) over the surface. The scatter plots (black dots) are raw data smoothed over three points, and the red lines are guide to the eye, showing the charge or size change duo the binding and unbinding of the molecule with Ca2+. e, g Charge and size histograms obtained from the first binding and unbinding cycle in d, f respectively. Both histograms show two peaks corresponding to the CaM molecule with and without Ca2+ binding.

