Fig. 1.
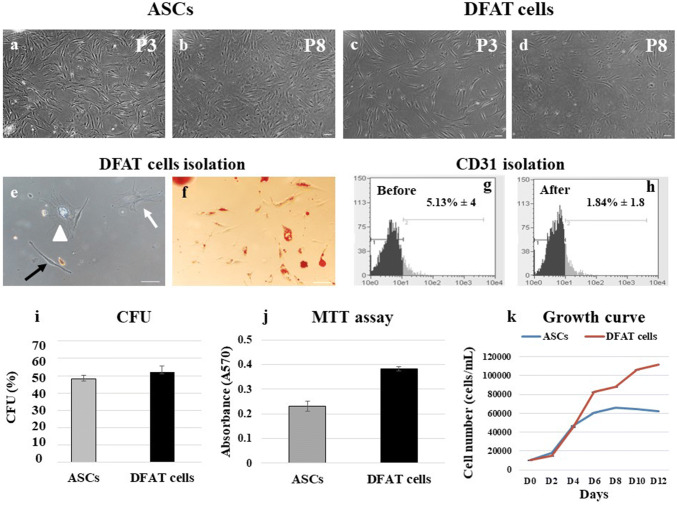
Cell morphology, CFU, MTT and PDT assays. a, b ASCs at passage 3 (P3) and passage 8 (P8) exhibited a fibroblast-like morphology. c, d DFAT cells of P3 and P8 also exhibited a fibroblast-like morphology. e In primary culture, DFAT cells can dedifferentiate from mature adipocytes and exhibit various morphologies: fibroblast-like (black arrow), polyhedral (white arrow), and lipid droplet-containing (white triangle). f Primary cells were stained with Oil Red O. g, h Via magnetic bead isolation, the percentage of CD31+ cells was reduced from 5.13% ± 4 to 1.84% ± 1.8. (n = 3). i Average %CFU for ASCs and DFAT cells. The proliferation of ASCs and DFAT cells was assessed using MTT (j) and PDT (k) assays (n = 4, each assay). The scale bar represents 100 μm

