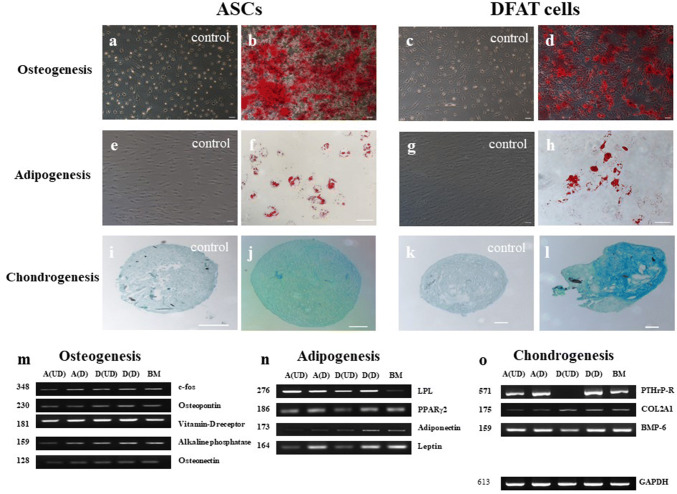
Fig. 5.
Multilineage differentiation potential and gene expression patterns. a–d Osteogenic differentiation of ASCs and DFAT was confirmed by Alizarin Red staining. e–h Adipogenic differentiation was confirmed by Oil Red O staining of lipid droplets. i–l 3-D pellets of chondrogenically differentiated cells were stained with Alcian blue. m–o Gene expression in each lineage was compared among undifferentiated ASCs (A(UD)), differentiated ASCs (A(D)), undifferentiated DFAT cells (D(UD)), differentiated DFAT cells (D(D)), and BMMSCs (BM). GAPDH was used as the endogenous control gene. The scale bar represents 100 μm

