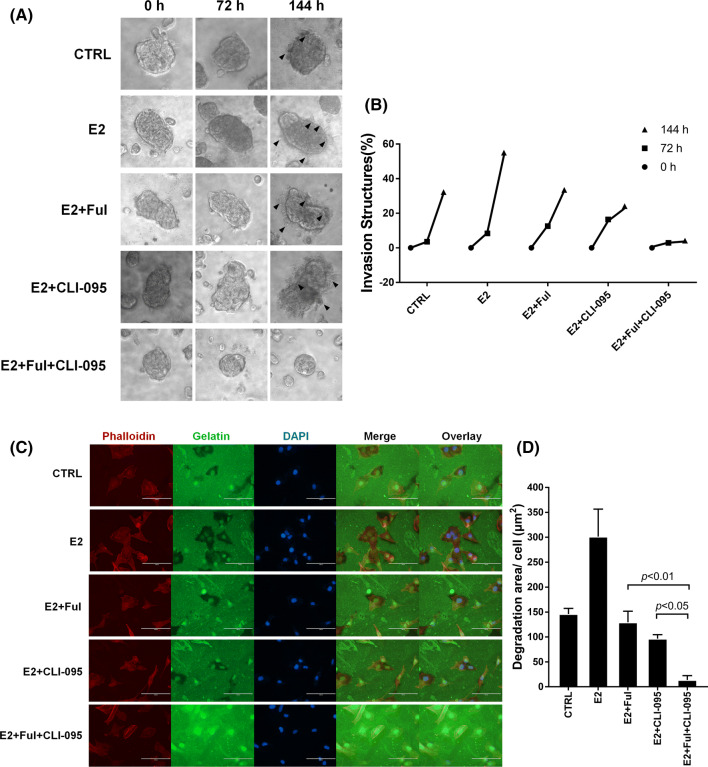
Fig. 4.
Combination treatment with Ful + CLI-095 restricted invadopodia formation in NSCLC cells. a 3D spheroid cell invasion assay of lung adenocarcinoma A549 cells treated with DMSO (CTRL), E2 (10 nM), E2 + Ful (100 nM), E2 + CLI-095 (100 nM), or E2 + Ful + CLI-095. Representative images were acquired at 0 h, 72 h, and 144 h (days 1, 3, and 6) via light microscopy (×100). Combination treatment with Ful + CLI-095 restricted invadopodia formation (black arrow) more than other treatments. b Quantification of 3D spheroid cell invasion assays. Quantification was carried out by measuring the distance between the invasive cell frontier and spheroid edge. c Fluorescent gelatin degradation assay. To confirm the invasive activity of cancer cells, slides were coated with FITC-conjugated gelatin (green). NSCLC cells were cultured on the FITC-conjugated gelatin-coated coverslips for 36 h. To visualize F-actin, phalloidin (red) and DAPI (blue) were used to stain the cytoplasm and nuclei, respectively. Punctuate black areas indicate representative degraded gelatin regions. Scale bar, 200 μm. d Quantification of the degradation level of the FITC-conjugated gelatin as assessed by the degradation assay (area per cell, μm2)

