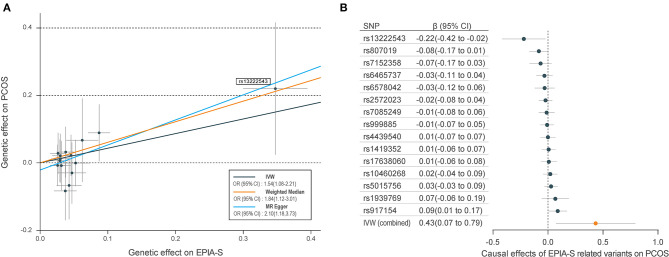
Figure 2.
Mendelian randomization (MR) plots for relationship of epiandrosterone sulfate (EPIA-S) with polycystic ovary syndrome (PCOS). (A) Scatter plot of potential effects of single-nucleotide polymorphisms (SNPs) on EPIA-S vs. PCOS, with the slope of each line corresponding to the estimated MR effect per method. SNPs showing negative signals with EPIA-S are plotted after orientation to the exposure-increasing allele. SNPs with higher effects on both metabolites and PCOS are marked on the plots. (B) Forest plot of individual and combined effects of EPIA-S related SNPs on PCOS. Data are expressed as raw β values with 95% confidence interval (CI).

