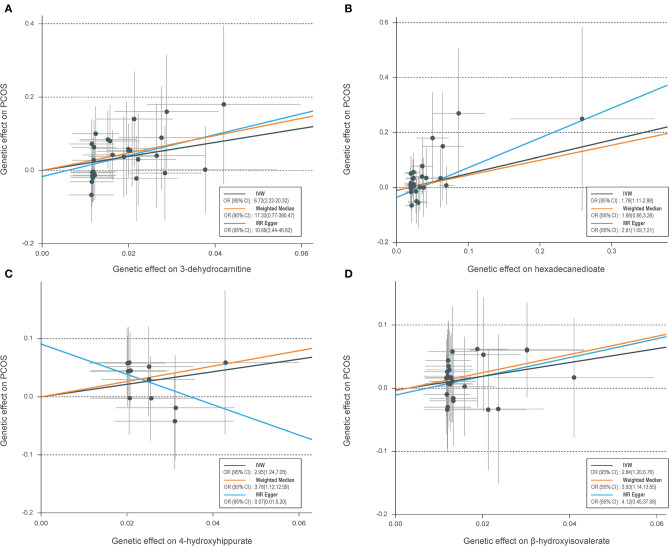
Figure 3.
Scatter plots of genetic associations with four suggestive metabolites vs. the associations with polycystic ovary syndrome (PCOS). (A) 3-Dehydrocarnitine; (B) hexadecanedioate; (C) 4-hydroxyhippurate; (D) β-hydroxyisovalerate. Each of the single-nucleotide polymorphisms (SNPs) associated with metabolites are represented by a black dot with the error bar depicting the standard error of its association with metabolite (horizontal) and PCOS (vertical). The slopes of each line represent the causal association for each method. SNPs showing negative signals with metabolites are plotted after orientation to the exposure-increasing allele.

