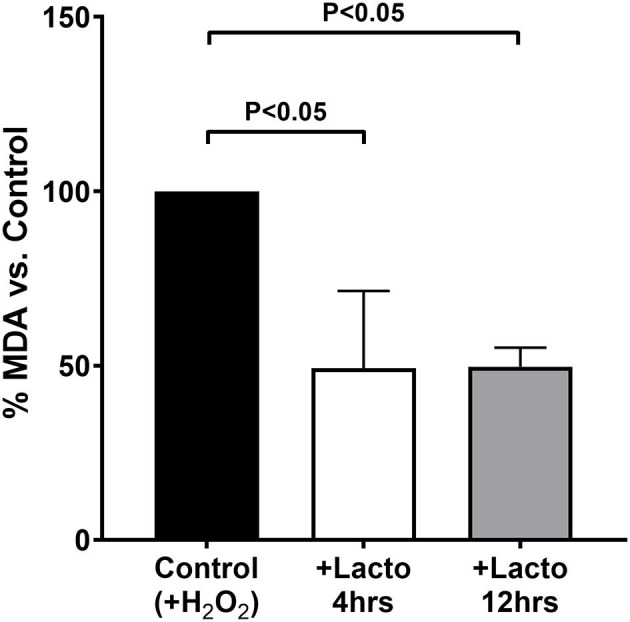
Figure 3.

MDA equivalents measured in cells treated 4 h (open bar) or 12 h (gray bar) with lactoferrin, or not treated as a control (black bar), and subjected to oxidative challenge with hydrogen peroxide. Values are normalized by the control and the data represent the mean ± SD of 3 independent experiments.
