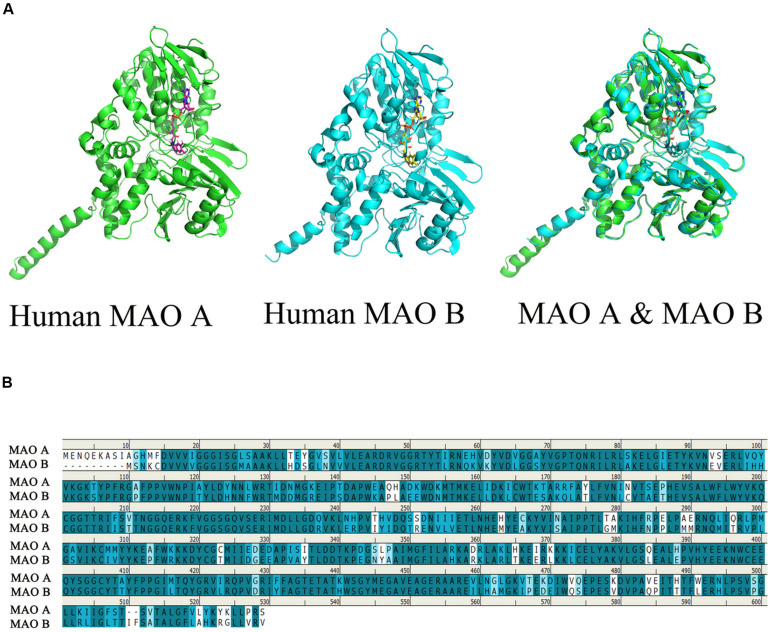
FIGURE 1.
Comparison of the structure of human MAO A and human MAO B. The picture is generated by PyMOL (Son et al., 2008). Use clustalw in MEGA software to perform multiple sequence alignment, generate alignment result files, and import the aligned sequences into geneDoc software for visualization (Boratyn et al., 2019). (A) Observe the overlapping structure of human MAO A and human MAO B in three-dimensional space. The same part between the two structures is shown in cyan. (B) Amino acid sequence identity comparison, blue is the sequence with higher similarity, the darker the color, the higher the similarity, the overall sequence identity between MAO A and MAO B is about 71.1%.

