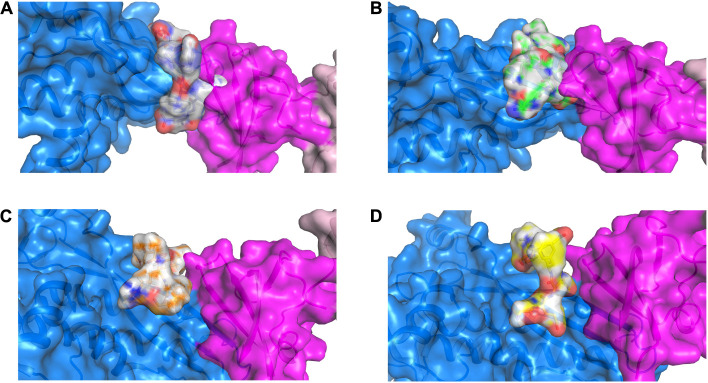
FIGURE 2.
3D representation of the RNAP β (marine), CarD (magenta) and peptide-based inhibitor binding interface displaying the top ranked pose for each peptide (gray) when docked onto RNAP β. (A) RNAP β and peptide 1; (B) RNAP β and peptide 2; (C) RNAP β and peptide 3; and (D) RNAP β and peptide 4.

