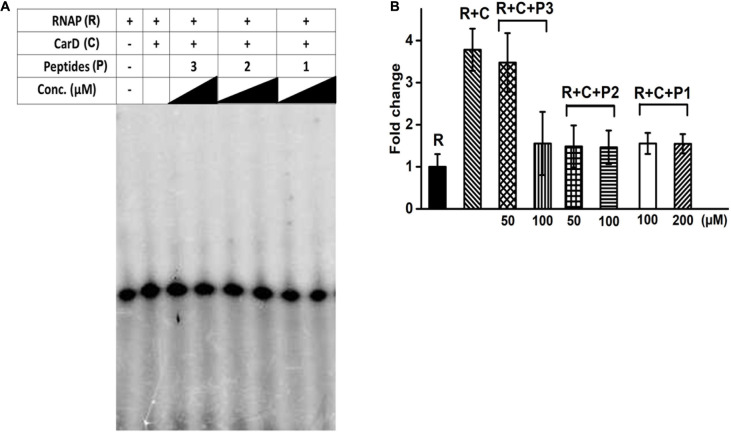
FIGURE 3.
(A) In vitro transcription assay in the presence of varying concentrations of designed interface peptides (10 μM – 1 mM) and Mtb CarD. (B) Densitometry analysis of the transcripts obtained in the denaturing gel shown in (A) in the presence of peptides 1–3. Abbreviations: R, RNAP; C, CarD; P1, Peptide 1; P2, Peptide 2; P3, Peptide 3.

