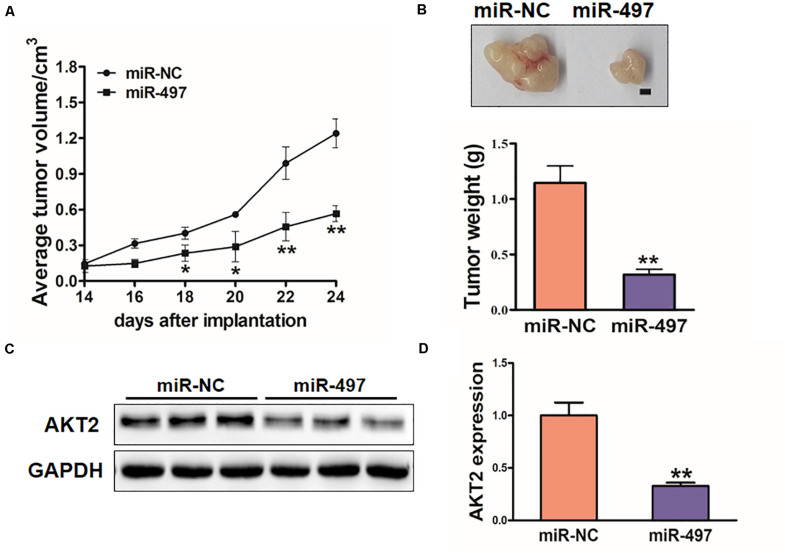
FIGURE 7.
MiR-497 inhibits tumorigenesis in vivo. (A,B) Tumor growth assay in nude mice. Tumor growth curve, representative pictures and average weight of xenograft tumors between the groups of miR-NC and miR-497. Bar: 2 mm. (C) Protein levels of AKT2 in xenograft tumors. (D) The expression levels of AKT2 were analyzed by qRT-PCR. Data were presented by mean ± SD. of 3 replicates. *indicated P < 0.05; **indicates P < 0.01.

