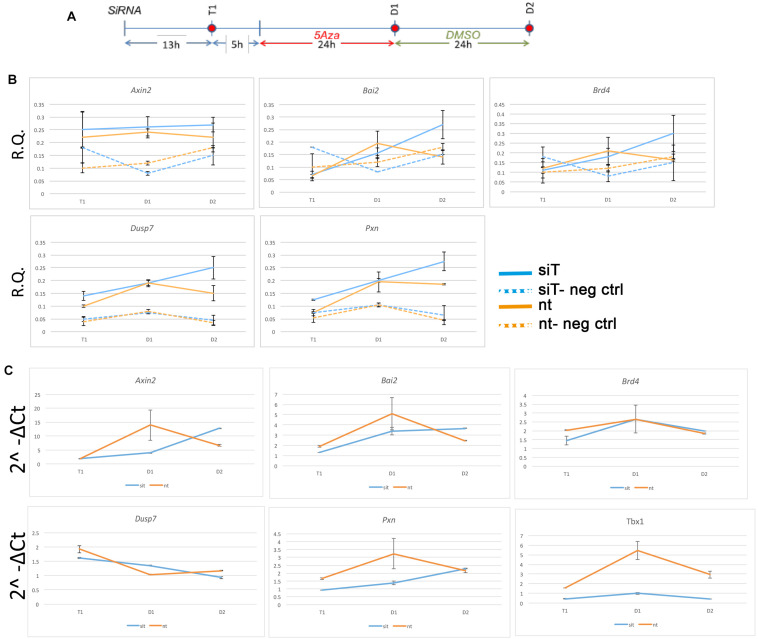
FIGURE 4.
Changes in chromatin accessibility during differentiation in P19Cl6 cells. (A) Experimental scheme illustrating the three time points tested, T1 (13 h after transfection of siRNA), D1 (24 h after 5Aza addition to the media), and D2 (24 h after addition of DMSO to the media). (B) Quantitative ATAC assays of previously identified TBX1 binding sites associated with the genes indicated. All sites were found to be accessible by ATAC-seq. In all cases, accessibility tends to increase at D2. The negative control locus is located in a gene desert region (see Table 2 for primers sequences). Values are the average of two biological replicates ± standard deviation. (C) Gene expression analysis by quantitative real time PCR of the same genes. Values are the average of two biological replicates ± standard error of the mean.

