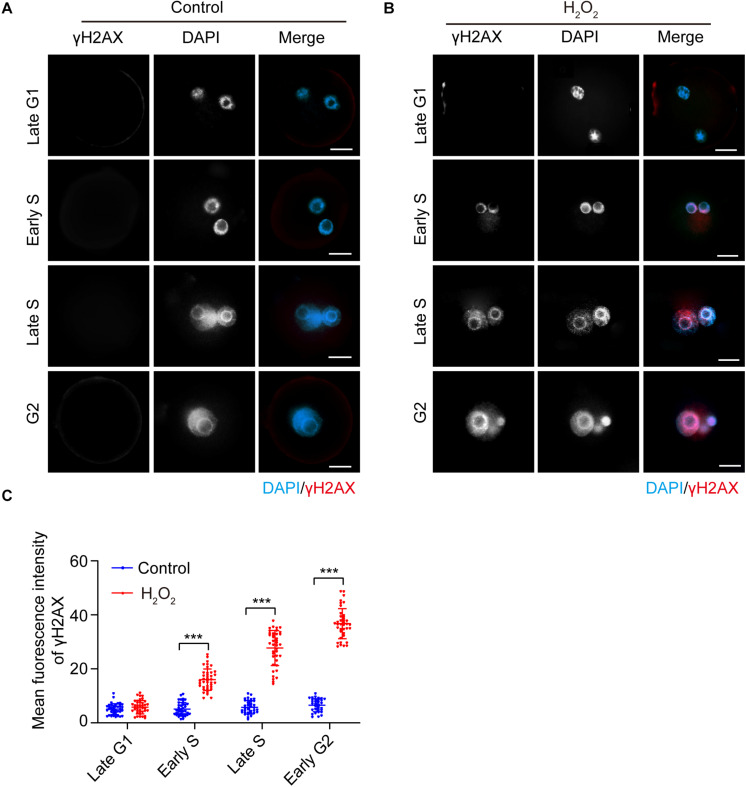
FIGURE 1.
γH2AX immunostaining (red) detection in the interphase of mouse zygotes. Nuclei were stained with DAPI (blue). (A) Control group. Scale bar = 20 μm. (B) H2O2-treated group. Scale bar = 20 μm. (C) Quantification of the mean fluorescence intensity of γH2AX in both control and H2O2-treated zygotes at different stages during interphase. N = 40 zygotes per group at each stage. Results were analyzed by Student’s t-test. ***p < 0.001. Error bars: SD.

