FIGURE 1.
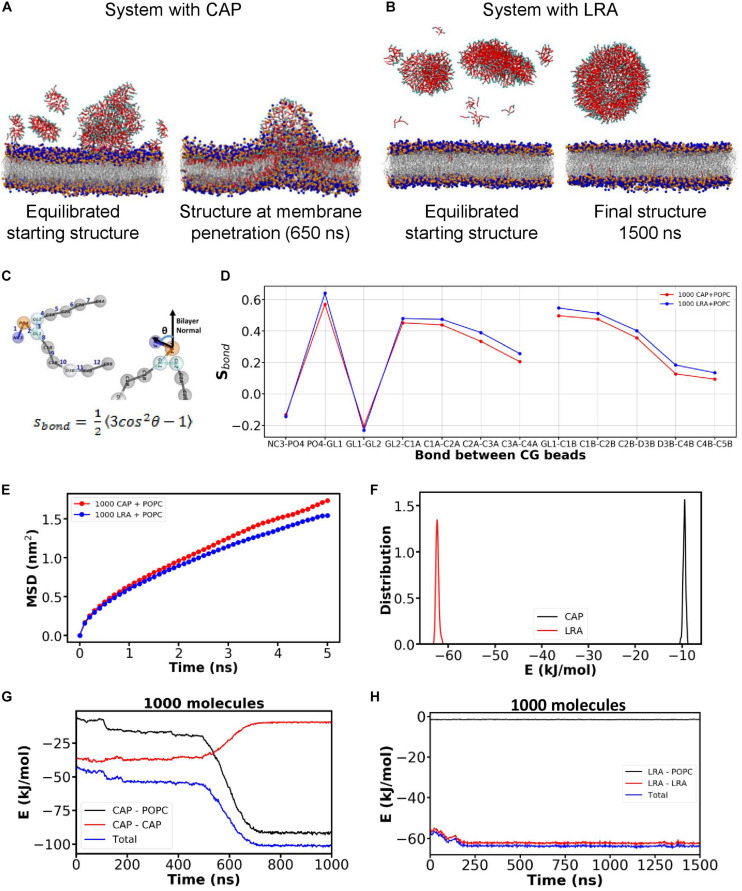
Molecular simulations show the interactions of CAP and LRA on a POPC bilayer. Snapshots from simulations of POPC bilayer systems containing (A) CAP, and (B) LRA. Head group of phospholipid molecules are depicted using blue and orange beads, phospholipid tails are represented with gray sticks. Hydrophobic tails for both CAP and LRA are represented with red beads and their hydrophilic head is represented as cyan beads. (C) Schematic representation depicting the bond between CG beads and formula for calculating the bond order parameter (Sbond). (D) Changes in the Sbond value across different bonds for POPC-CAP and POPC-LRA systems depicting lipid tail ordering for both systems. (E) Mean square displacement (MSD) of lipid molecules in the bilayers of POPC-CAP and POPC-LRA systems indicate differences in membrane fluidity of the two bilayer systems. (F) The total non-bonded potential energy of interaction among LRA molecules versus that of CAP molecules computed as sum of Lennard Jones potential to understand which interactions are favorable. Non-bonded potential energy of interaction between different components of the system as a function of time for (G) the CAP-POPC system and (H) the LRA-POPC system during the simulation.

