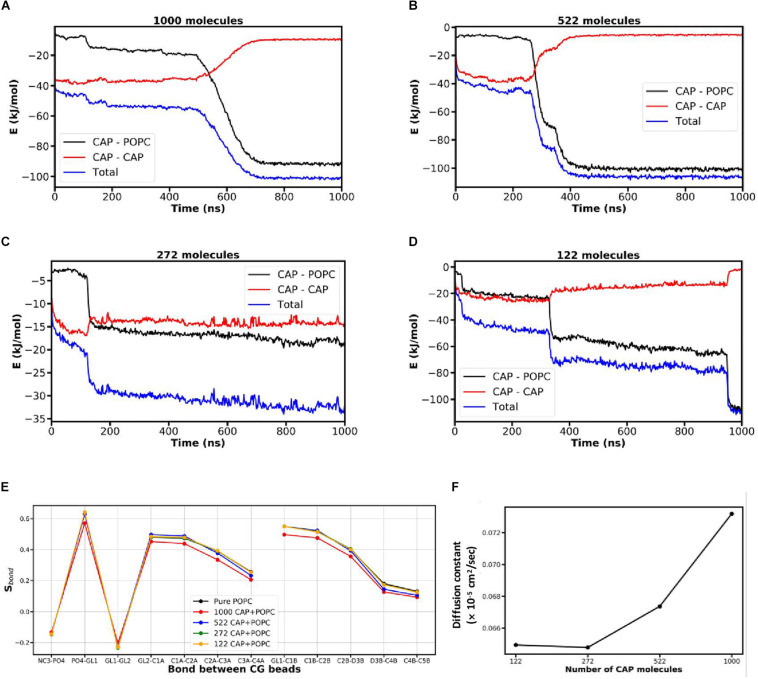
FIGURE 2.
Effect of different concentrations of CAP on the POPC bilayer. (A–D) Transitions in the CAP-CAP and CAP-POPC components representing the time range at which CAP molecules penetrate the POPC bilayer. (E) Lipid tail ordering and (F) diffusion constant for the different concentrations of CAP computed using the non-bonded potential energy of interaction near the transition states due to penetration of CAP.

