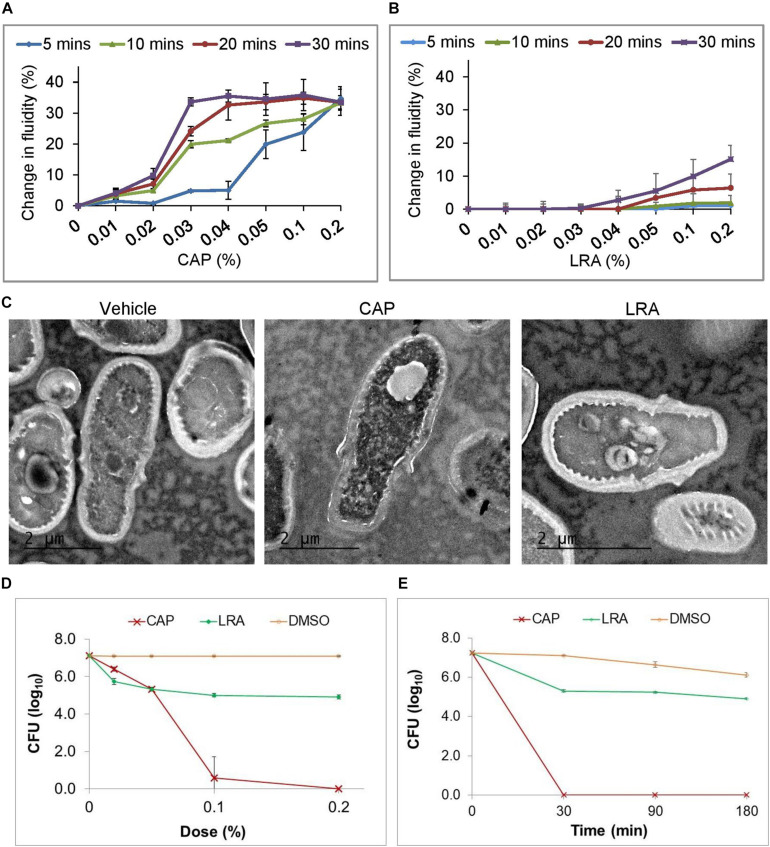
FIGURE 3.
In vitro antifungal activities of CAP and LRA. Changes in membrane fluidity of DPH labeled M. furfur cells treated for 4 different durations of exposure to increasing concentrations of (A) CAP and (B) LRA (n = 3 for each group, each time point). (C) TEM images of vehicle-treated (left), CAP treated (center) and LRA treated (right) cells. (D) Effect of increasing dose of CAP or LRA on M. furfur. Cells in broth were treated with a fatty acid at the indicated concentrations (0.02, 0.05, 0.1, and 0.2%) for 30 min. Colony forming units (CFUs) were counted 48 h after plating and plotted as survival. (E) Effect of increasing duration of exposure of M. furfur to CAP or LRA tested at a dose of 0.2%. Cells were treated with CAP or LRA in broth and samples were plated at the indicated time points (30, 90, and 180 min). CFUs were counted 48 h after plating and plotted as survival. Data represent the average of at least three biological replicates with error bars indicating standard deviation.

