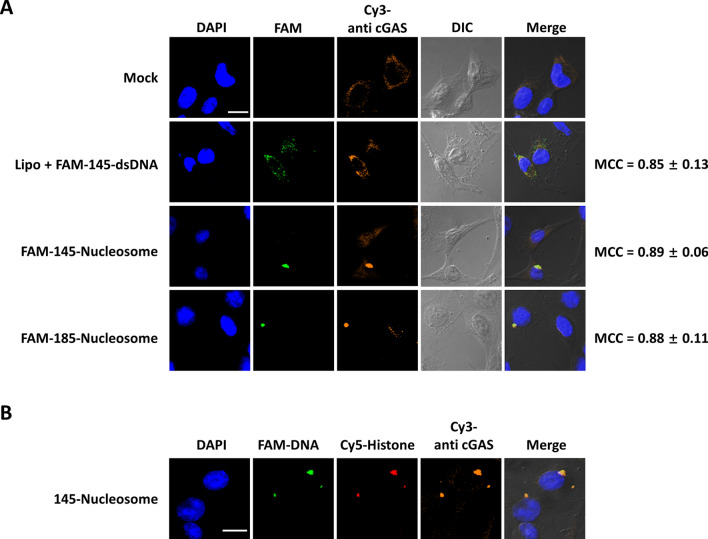
Figure 4.
Confocal fluorescence microscopy analyses of the cellular location of nucleosomes and cGAS in L929 cells. (A) Representative images showing the cellular location of dsDNA, nucleosomes and cGAS after incubation for 12 h. MCC (Manders' colocalization coefficient) is the ratio of FAM signal that overlaps with Cy3 signal to the total signal of FAM. (B) Representative images showing the cellular location of FAM and Cy5 dual labelled 145-nucleosomes and cGAS after incubation for 12 h. FAM was tagged on the 5′ end of one DNA strand and Cy5 was conjugated in histone H3. Cy3 labelled secondary antibody was used for the immunofluorescence of cGAS. Scale bar, 20 μm.

