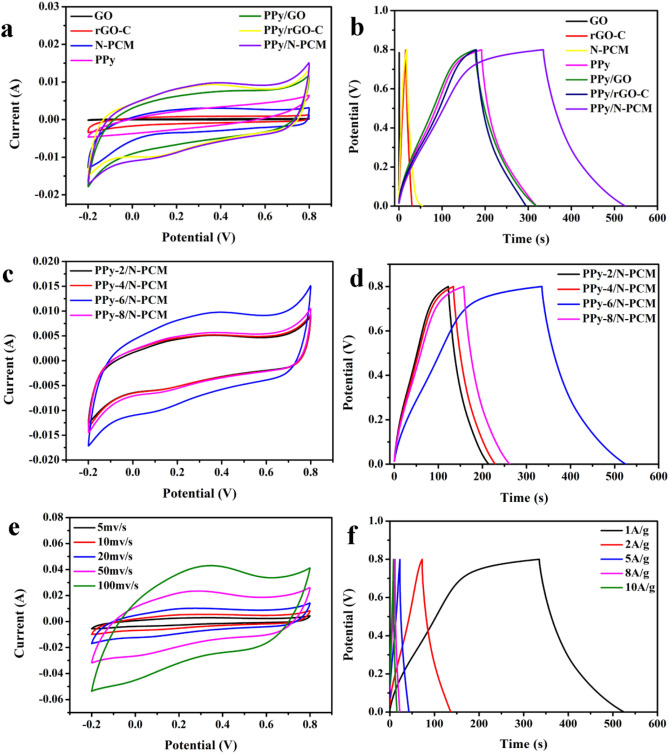
Figure 7.
CV curves of GO, rGO-C, N-PCM, PPy, PPy/GO, PPy/rGO-C and PPy/N-PCM at a scan rate of 20 mV s−1 (a), GCD curves of GO, rGO-C, N-PCM, PPy, PPy/GO, PPy/rGO-C and PPy/N-PCM at the current density of 1 A g−1 (b); CV curves of PPy/N-PCM with different concentration at a scan rate of 20 mV s−1 (c); GCD curves of PPy/N-PCM with different concentration at the current density of 1 A g−1 (d); CV curves of PPy/N-PCM at different scan rates (e); and GCD curves of PPy/N-PCM at different current density (f).

