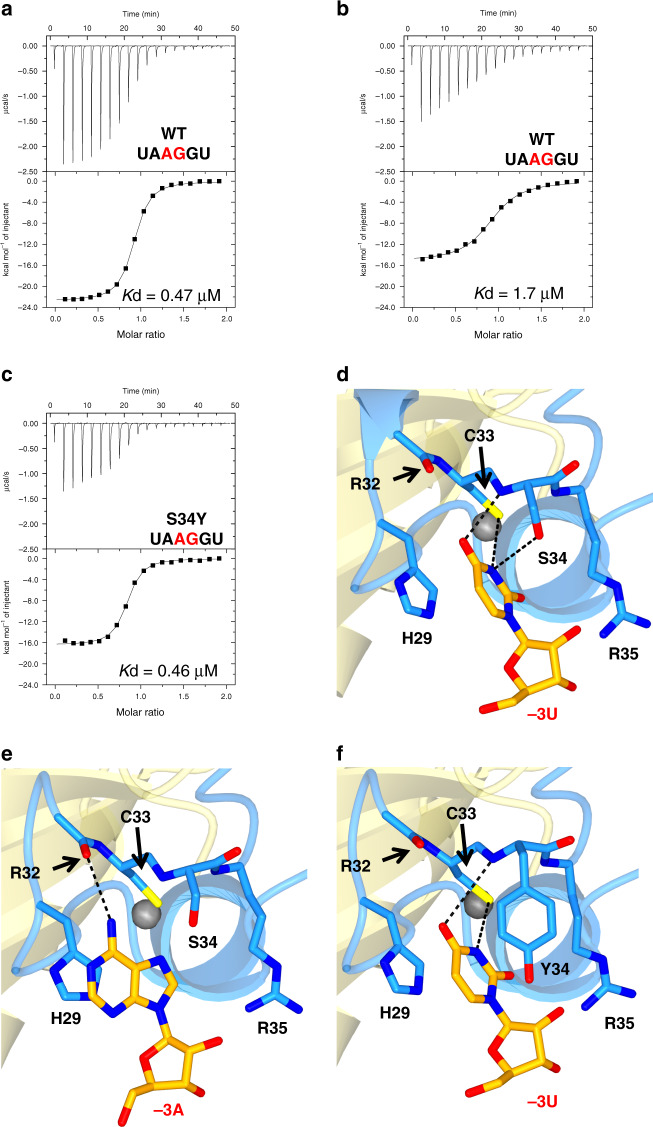
Fig. 4. Interaction of U2AF1 with the nucleotide at −3 position.
a Binding affinities of U2AF1 WT for the 5′-UUAGGU RNA, b for the 5′-UAAGGU RNA, and c S34Y for the 5′-UAAGGU RNA measured by ITC. Raw data and the corresponding binding curve are depicted. Mean value for the dissociation constant (Kd) with standard deviation is based on three independent measurements. Representative views of the interaction (d) between U2AF1 WT and −3 uridine, e between U2AF1 WT and −3 adenine, and (f) between U2AF1 S34Y and −3 uridine. U2AF1 and RNA are colored as in Fig. 1b.

