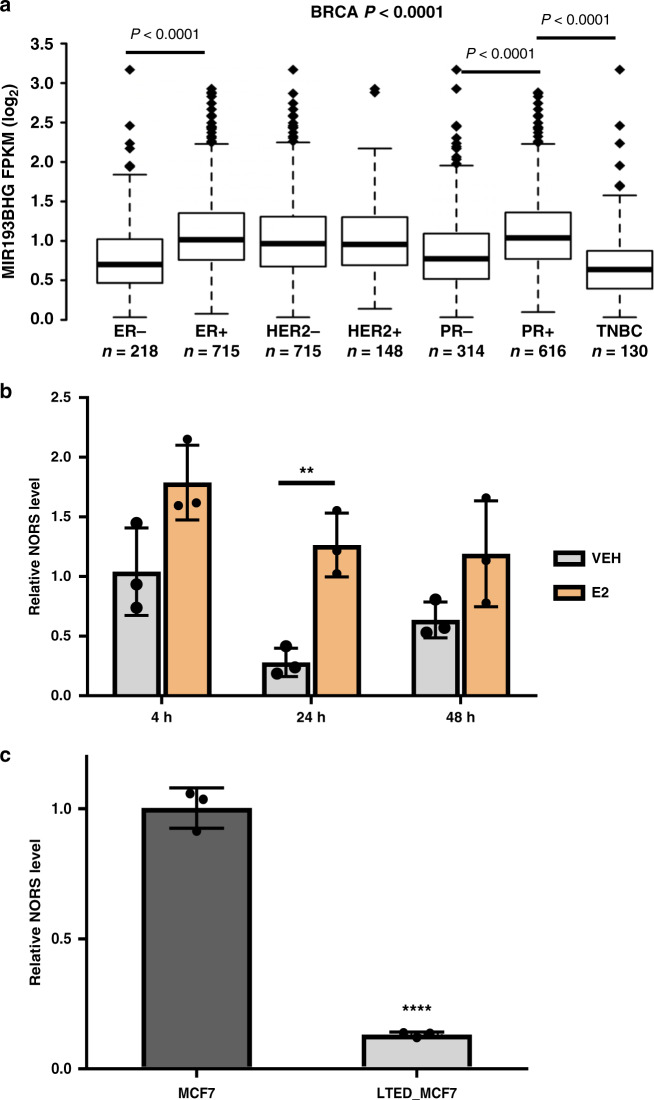
Fig. 3. lincNORS is associated with estrogen response.
a lincNORS/MIR193BHG level in subtypes of breast cancer tumors in TCGA database. Boxplot represents first (lower bound), median (bar inside), and third (upper bound) quartiles, whiskers represent 1.5 times the interquartile range. Kruskal–Wallis test followed by Dunn’s multiple comparison test. b qPCR analysis of lincNORS in MCF-7 cells treated with 10 nM E2 or vehicle control for the indicated time. Data are shown as mean ± SD from three biological replicates (**p = 0.004, two-sided Student’s t-test). c qPCR analysis of lincNORS level in MCF-7 and long-term estrogen-deprived MCF7 cells. Data are shown as mean ± SD from three biological replicates (****p < 0.0001, two-sided Student’s t-test).

