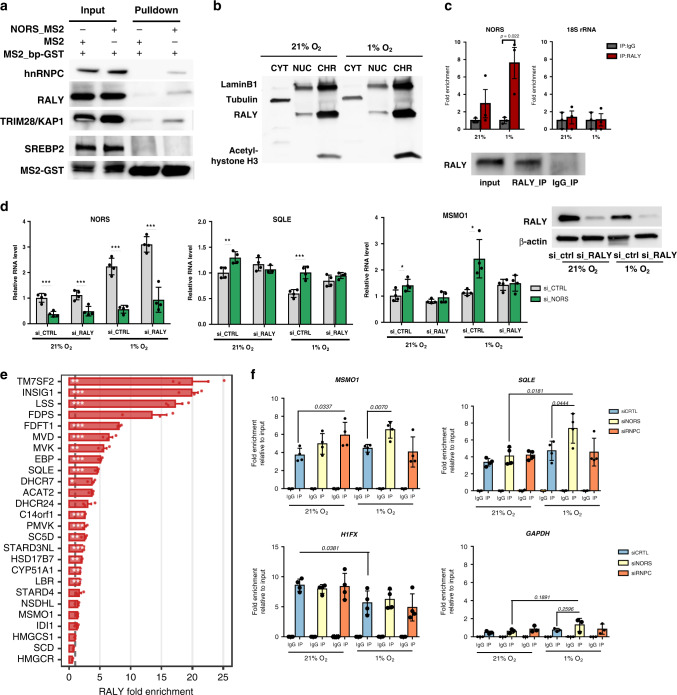
Fig. 6. lincNORS regulates cholesterol synthesis via interaction with RALY.
a The level of hnRNPC, RALY, TRIM28, SREBP2, and MS2-GST in the MS2 pulldown material and input lysate was detected by western blot. The data presented are a representative image from two to three independent experiments. b Subcellular location of RALY was detected by western blot. Tubulin, Lamin-B1, and acetyl-histone H3 were included as controls for cytoplasmic, nuclear, and chromatin-associated fractions. A representative image from three independent experiments is shown. c RNA immunoprecipitation (RIP) analysis of RALY. The presence of lincNORS and 18s rRNA in the precipitated complex was detected by qPCR. Data represent mean ± SD from three biological replicates (two-sided Student’s t-test). d qPCR analysis of NORS, MSMO1, and SQLE expression in MCF-7 cells transfected with control, lincNORS siRNA, and/or RALY siRNA. Data represent mean ± SD from four biological replicates (two-sided Student’s t-test). RALY knockdown was confirmed by western blot in each experiment and a representative image is shown on the right. e Enrichment of RNA of cholesterol synthesis genes in RALY-containing immunoprecipitated complex. The barplot displays the mean fold enrichment ± S.E.M. from three independent RALY RIP-Seq vs control experiments in MCF7 cells. The statistical significance of the enrichment was determined with CuffDiff v2.2.1 (*FDR < 0.05, **FDR < 0.01, ***FDR < 0.001). Source data are provided as a Source Data file. f Enrichment of MSMO1, SQLE, H1FX, and GAPDH in RALY-containing immunoprecipitated complex after lincNORS or hnRNPC knockdown was detected by qPCR. Data represent mean ± SD from four biological replicates (two-sided Student’s t-test).

