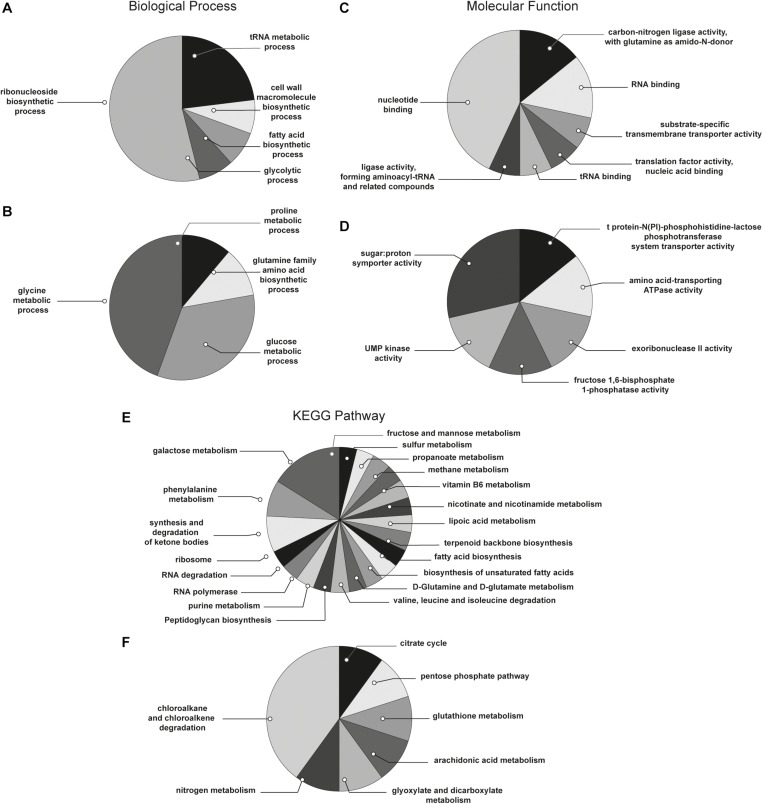
FIGURE 3.
Functional enrichment and cluster analysis. The pie chart reports the most represented biological processes of (A) sessile and (B) planktonic S. epidermidis GOI1153754-03-14; the molecular functions of (C) sessile and (D) planktonic S. epidermidis GOI1153754-03-14 and the KEGG pathways of (E) sessile and (F) planktonic S. epidermidis GOI1153754-03-14.

