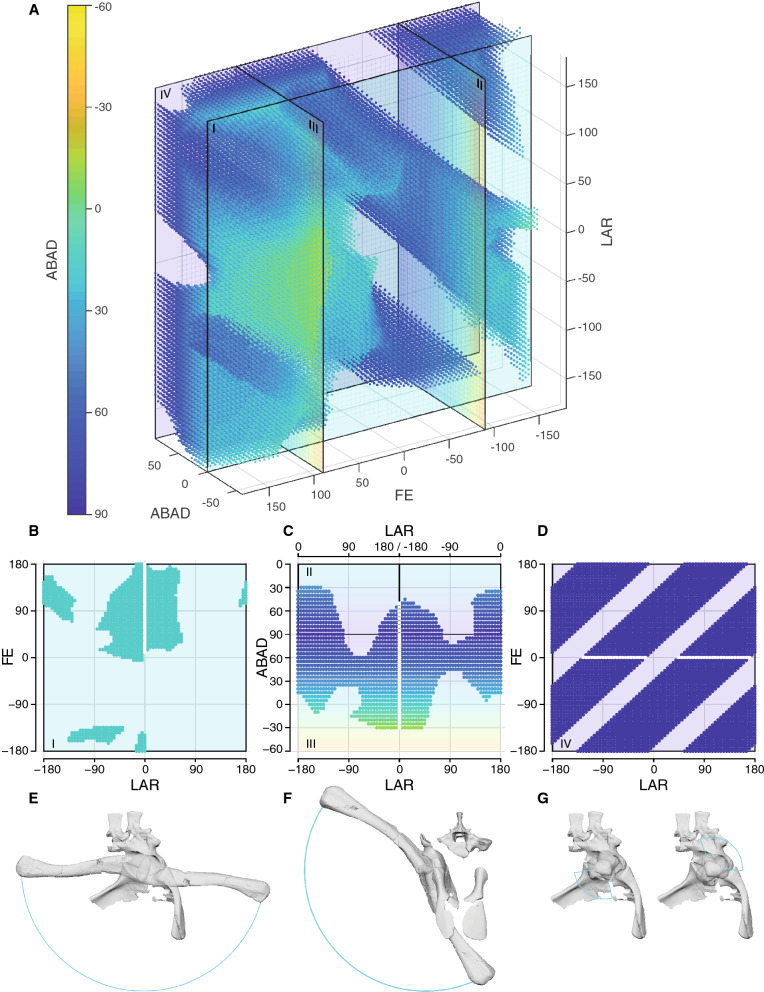
Figure 4.
Hip joint ROM analysis. (A) Point cloud of all viable poses for simulation SAM PK 6047A SE0. (B–D) ROM cross-sections; (B) ABAD = 0° (I); (C) FE = − 90° (II) and FE = 90° (III); (D) ABAD = 90° (IV); roman numerals indicate position of cross-sections in (A). The white lines indicate the path of the femur shown in (E, F). To show the full ABAD swing in (C) two cross-sections (II and III) were combined into a single plot. (E–G) Corresponding maximal excursions of the femur to the cross-sections above in lateral view (E, G) and cranial view (F). Note the disconnected ‘locked’ areas of viable poses (D) indicating that the femur cannot swing through the stance phase (G).

