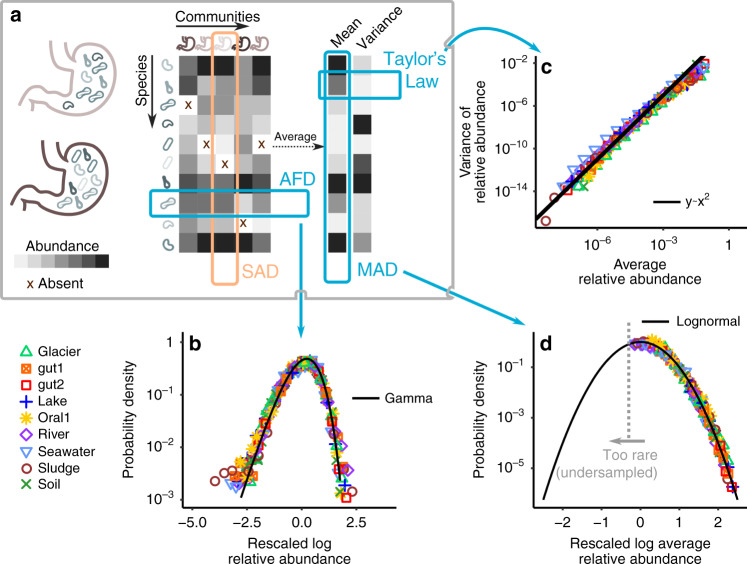
Fig. 1. Laws of variation in microbial communities.
a The species abundance distribution (SAD) describes the fluctuations of abundance across species in a community. b The Abundance Fluctuation Distribution (AFD) describes the distribution of abundances of a species across communities. I consider cross-sectional data from 9 data sets (colored symbols, see Methods). A Gamma distribution (solid black line) closely matches the AFD, here reported for the most abundant species (see Methods). The Gamma distribution describes the AFD of both abundant and rare species (Supplementary Note 1 and Supplementary Fig. 2). c The mean and variance of the abundance distribution are not independent across species, a relationship known as Taylor’s Law. The variance is, in fact, proportional to the square of the mean (solid line), implying that the coefficient of variation of the abundance fluctuations is constant across species (Supplementary Fig. 7). Taylor’s Law (together with a Gamma AFD) implies that a single parameter per species (the average abundance) recapitulates the distribution of fluctuations. d The Mean Abundance Distribution (MAD), defined as the distribution of mean abundance (obtained by averaging over communities) across species, is Lognormally distributed (black line, Supplementary Note 7).

