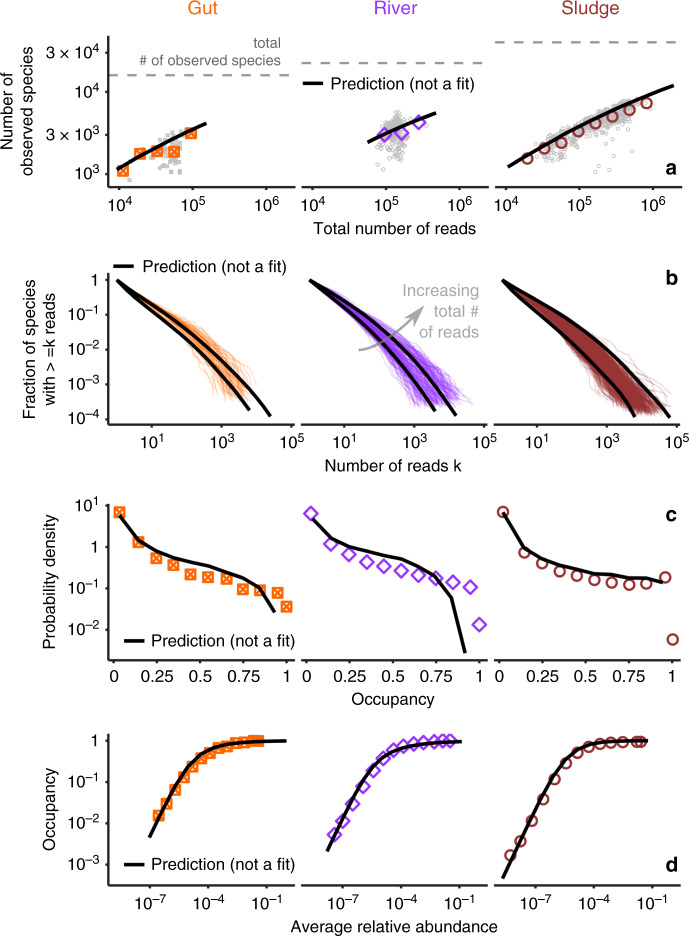
Fig. 3. The AFD, Taylor’s Law and MAD quantitatively predict macroecological patterns.
a Scaling of diversity (measured as the number of species) with the total number of reads (Supplementary Fig. 13). b Species abundance distribution (Supplementary Fig. 17). c Occupancy distribution (Supplementary Fig. 15). d Abundance-occupancy relation21 (Supplementary Fig. 16). Data are colored points/line. Predictions (black lines) are obtained from the macroecological laws without fitting any additional parameter. Gray points in (a) are individual communities (colored points are averages).

