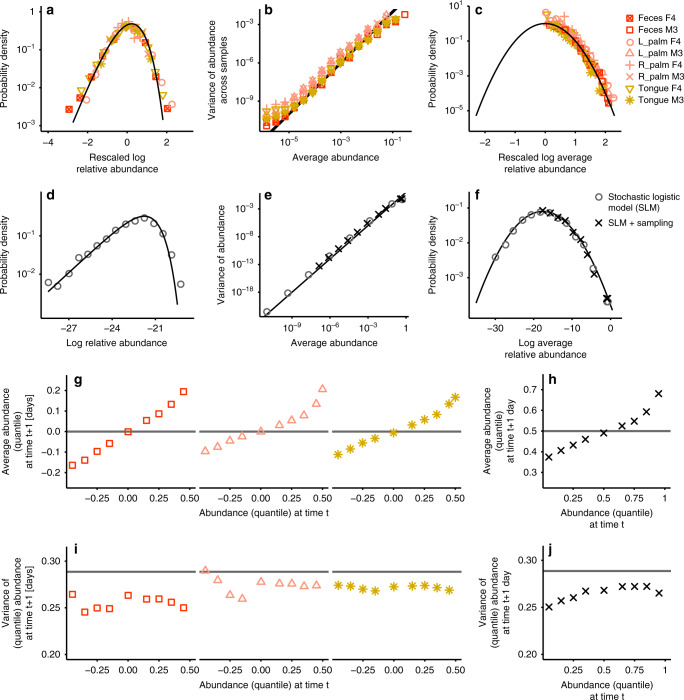
Fig. 4. Macroecological laws hold for temporal data.
a–c The same laws that describe presence and abundance variation across the community (black lines) also hold for time data (colored points, see Methods and Supplementary Note 9). d–f The stochastic logistic model (SLM) reproduces the empirically observed AFD, Taylor’s law and MAD, respectively. Gray circles are the results obtained with the SLM, and the black crosses the ones obtained using SLM together with sampling. g The average quantile abundance given an average quantile abundance in the previous day (averaged over species, see Methods). The gray solid line shows the expected relation in the absence of time dependence. i Similar to (g), the variance of the quantile abundance given an average quantile abundance in the previous day (averaged over species). h, j The SLM correctly predicts the non-stationary properties shown in (g) and (i) (see Methods).

