Figure 3.
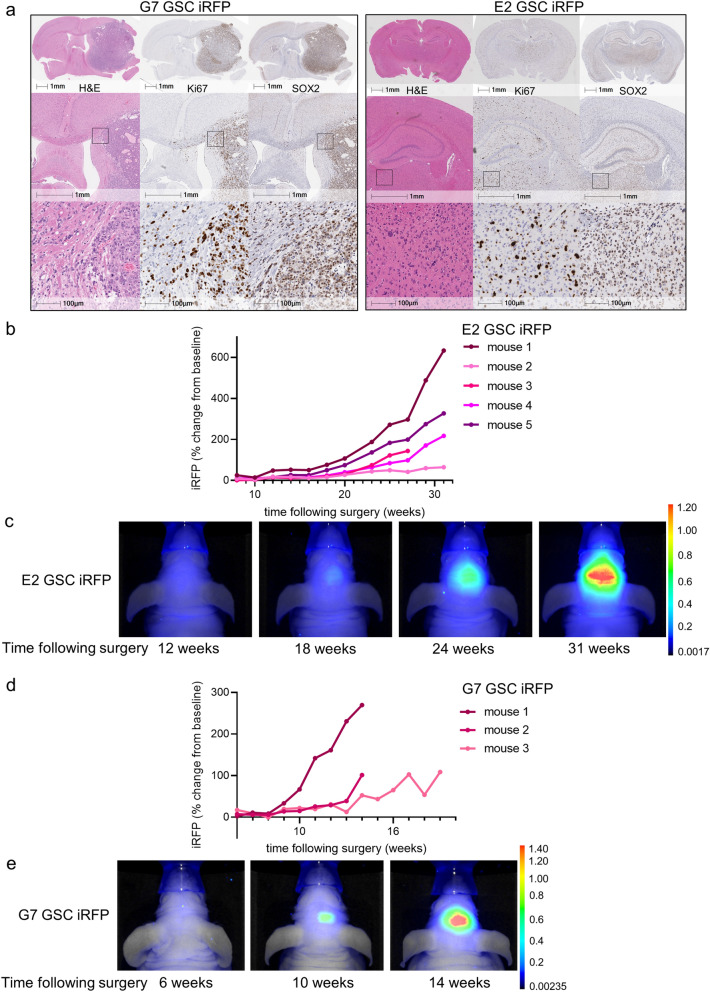
Quantitative imaging of iRFP-expressing glioblastoma in vivo. (a) Representative images of haematoxylin and eosin (H&E), Ki67 and SOX2 immunohistochemistry of brain sections containing orthotopic tumours derived from intracranially injected G7 or E2 GSC iRFP. (b) E2 GSC iRFP were injected intracranially into five mice. iRFP signal increase was measured at indicated times (c,e). Pseudocolour representations of iRFP signal increase over time in individual mice bearing E2 or G7 GSC iRFP tumours, respectively, as detected by PEARL scans (700 nm channel). (d) G7 GSC iRFP were injected intracranially in three mice. iRFP signal increase measured at indicated times.

